Immigration statistics, October to December 2013
Published 27 February 2014

© Crown copyright 2014
This publication is licensed under the terms of the Open Government Licence v3.0 except where otherwise stated. To view this licence, visit nationalarchives.gov.uk/doc/open-government-licence/version/3 or write to the Information Policy Team, The National Archives, Kew, London TW9 4DU, or email: psi@nationalarchives.gov.uk.
Where we have identified any third party copyright information you will need to obtain permission from the copyright holders concerned.
This publication is available at https://www.gov.uk/government/statistics/immigration-statistics-october-to-december-2013/immigration-statistics-october-to-december-2013
This release presents the latest immigration statistics from Home Office administrative sources, covering the period up to the end of December 2013.
This is not the latest release. View latest release.
Valid: 27 February 2014 to 22 May 2014
1. Summary Points: October to December 2013
All data below relate to the calendar year 2013 and all comparisons are with 2012, unless indicated otherwise.
1.1 Key points from the latest release
Asylum
There was an 8% increase in asylum applications in 2013 (23,507) compared with 2012 (21,843), although well below the peak number of applications in 2002 (84,132). The increase in 2013 was particularly driven by rises from Syria (+681), Eritrea (+649) and Albania (+507). While Syria saw the largest increase in applications, it remains fourth for overall numbers of asylum applications.
Visitor visas issued (Before entry)
1.9 million visitor visas were issued in 2013, 14% more (+245,093) than in 2012. Increases were seen for a range of nationalities, including Chinese (+81,575), Russian (+35,658), Kuwaiti (+25,324), Indian (+17,973) and Saudi Arabian (+15,227) nationals.
Work
There were 7% more work-related visas issued (to 154,860 in 2013) . The increase was largely accounted for by higher numbers for skilled workers (Tier 2, +18%), and for Youth mobility and temporary workers (Tier 5, +7%). The increases in Tier 2 and in Tier 5 was offset by fewer visas issued for high value workers (Tier 1) which fell by 35%. There were 13% fewer work-related extensions (falling to 122,451 in 2013) and 5% fewer permissions to stay permanently (falling to 59,249 in 2013).
Study
Study-related visas issued rose by 4% (to 218,773 in 2013). The increase includes higher numbers for Chinese, Brazilian and Malaysian nationals and falls for other nationalities, including Pakistan and India. There was a similar number of sponsored study visa applications (210,103 main applicants in 2013). There was a 7% rise in sponsored visa applications for the university sector, and falls in the further education sector (-34%), English language schools (-2%) and independent schools (-2%).
Family
There were 33,690 family route visas issued in 2013, a fall of 18%. Family-related grants to stay permanently rose by 26% (to 59,638 in 2013), although they were still lower than in 2009 (72,239). The increase was driven by an increase in grants to spouses.
EEA
For Bulgarian and Romania (EU2) nationals, there were falls in approvals for accession worker cards by 15% (to 1,526) and for registration certificates by 42% (to 12,930); these falls corresponded with falls in applications for both compared with 2012. EU2 nationals approved under the Sector Based Scheme (SBS) continued to fall, by 31% (to 335) and issuance of work cards under the Seasonal Agricultural Workers Scheme (SAWS) fell by 6% (to 19,630). However, figures for these schemes do not provide a full picture; in particular they exclude the self-employed.
1.2 Other points to note
Admissions
There were 111.1 million journeys to the UK, a 4% increase.
Visas issued (Before entry)
In total there were 532,574 visas issued in 2013, excluding visitor and transit visas, 5% higher than in 2012, with increases in grants of work visas (+9,750) and of study visas (+9,024, with increased applications for the university sector), and a fall in family visas granted (-7,202).
Student visitors
There was a 14% increase in student visitor visas issued, to 77,664. Student visitors are normally only allowed to stay for up to 6 months (11 months for English Language schools) and cannot extend their stay.
Extensions
There were 17% more grants of extensions (rising to 306,060 in 2013). This followed annual falls in each of the previous 3 years. The increase included a rise in study-related grants of extensions of a third and in family-related grants of extensions of more than double. Family-related grants of extensions more than doubled, rising from 16,627 to 40,670. Nearly two thirds (64%) of this increase was due to grants in the new Family Life (10-year) category (which would have previously been considered for discretionary leave).
Settlement
There were 18% more people granted permission to stay permanently (settlement), rising to 152,949 in 2013. This was still notably lower than in 2010 (241,192). The increase was accounted for by rises in family-related grants (+12,264), asylum-related grants (+9,288), and discretionary or other grants (+4,594). These rises were offset partially by a fall in work-related grants (-2,946).
Detention
The number of people entering detention in 2013 increased to 30,423, up 5%. Over the same period there was an increase of 5% in those leaving detention (to 30,036). As at the end of December 2013, 2,796 people were in detention, 4% higher than at the end of December 2012. In the fourth quarter of 2013, 63 children entered detention, compared with 65 in the fourth quarter of 2012.
Removals and Voluntary Departures
In 2013 the number of passengers refused entry at port and who subsequently departed increased by 2% and there was an increase of 10% in total number of voluntary departures. The number of enforced removals from the UK fell by 11% (to 13,051), which is the lowest figure since the series began in 2004.
Further, more detailed, analysis can be found below.
2. Data tables
Listing of the data tables included in ‘Immigration statistics, October to December 2013’.
3. Work
Valid: 27 February 2014 to 22 May 2014
3.1 Introduction
This section includes figures on work-related visas issued, passenger arrivals, extensions granted, and permissions to stay permanently for non-EEA nationals. It also includes figures on long-term immigration to work (i.e. those intending to stay for at least 12 months for work) for non-EU nationals.
3.2 Key facts
In 2013, there were 7% more work-related visas issued (reaching 154,860), 13% fewer extensions (down to 122,451) and 5% fewer permissions to stay permanently (down to 59,249) compared with 2012.
In the year ending September 2013, there were 5% fewer non-EU long term immigrants for work (down to 43,000 estimated from the International Passenger Survey) than in the previous 12 months.
The 7% increase in work-related visas was largely accounted for by higher numbers for skilled workers (Tier 2, +11,927 or +18%), and for Youth mobility and temporary workers (Tier 5, +2,779 or +7%). The increase in skilled workers included 4,777 more visas in the short term Intra Company Transfer category. This was partially offset by fewer visas issued for high value workers (Tier 1) which fell by 6,389 (-35%). The fall for high value workers (Tier 1) followed the closure of the Tier 1 General and Tier 1 Post-Study categories to new applicants.
The 13% fall (-18,496) in work-related extensions in 2013 included a fall in Tier 1 Post-Study extensions. There were increases for Tier 1 General and Tier 2 Skilled Workers, the latter reflecting shorter visas granted for such workers from 2008. Further information is given in the extensions topic.
In 2013, there were 47,835 skilled worker (Tier 2) sponsored visa applications (main applicants), an increase of 17%. The majority of applications were for the Information and Communication (20,171), Professional, Scientific and Technical Activities (8,569), and Financial and Insurance Activities (5,875) sectors.
Work immigration: latest trends
| 2013 | 2012 | Change: latest 12 months | Percentage change | |
|---|---|---|---|---|
| Work-related visas issued | 154,860 | 145,110 | +9,750 | +7% |
| of which: | ||||
| High value (Tier 1) visas | 11,616 | 18,005 | -6,389 | -35% |
| Skilled (Tier 2) visas | 80,031 | 68,104 | +11,927 | +18% |
| Youth mobility and temporary workers (Tier 5) visas | 41,060 | 38,281 | +2,779 | +7% |
| Non-PBS/Other | 22,153 | 20,720 | +1,433 | +7% |
| Year ending Sep 2013 | Year ending Sep 2012 | Change: latest 12 months | Percentage change | |
| Long-term immigration for work (1) | 43,000 | 45,000 | -2,000 | -5% |
Table notes
Source: Home Office, Immigration Statistics October to December 2013, Before entry table be 04, International Passenger Survey, Migration, Office for National Statistics.
(1) Immigration for work data are estimates of the number of non-EU nationals intending to change their residence to the UK for at least 12 months based on the International Passenger Survey.
3.3 Long-term trends in work-related immigration
There have been falls in work-related visas issued, admissions and non-EU immigration since 2006 although recent falls have been at a reduced rate compared with previous falls, and visas issued data has started to increase.
The chart below shows that International Passenger Survey (IPS) estimates of non-EU immigration are substantially lower than work-related visas and admissions. However, the IPS estimates follow a broadly similar trend with increases in all three series between 2005 and 2006 followed by subsequent falls. Two reasons why IPS estimates of immigrants for work are lower than figures for work visas issued or passenger arrivals are that the IPS figures exclude any workers who intend to stay for less than a year and exclude dependants. Further reasons are described in the user guide. The chart below also shows trends in extensions and permanent stay (settlement) for work reasons.
Long-term trends in work-related immigration
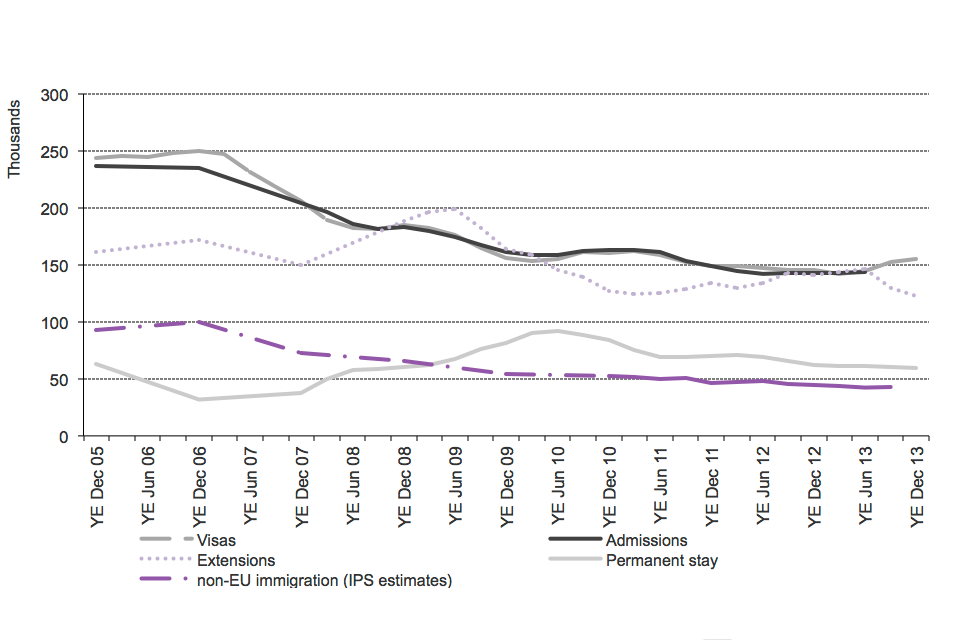
Chart notes
Source: Home Office, Immigration Statistics October to December 2013, Before entry volume 2 table be 04 q, Admissions table ad 02 q, Extensions table ex 01 q and Settlement table se 02 q; Office for National Statistics, Migration.
3.4 Work-related immigration by nationality
Admissions data includes both those individuals who require a visa to enter the UK and those who in some circumstances don’t (for periods of up to 6 months), known as ‘non-visa nationals’. Work-related admissions data are included in Admissions tables ad 02 to ad 03 and ad 03 w.
For both work-related visas and admissions, the highest numbers relate to Indian, Australian and United States nationals. In 2012, the top 10 nationalities (see chart below) were the same for both series, apart from a difference in the order. Some of the differences in the ranking between visas and admissions data for 2012 may be due to timing differences, for example, some visas granted in 2012 may be used in 2013. Additionally, some individuals admitted within the creative and sporting category (part of Tier 5) do not need a visa, and this largely explains the higher number of admissions (estimated at 26,700) of United States nationals compared to numbers issued with a visa (13,703).
Top 10 nationalities issued work-related visas, 2012
(Total 145,110)
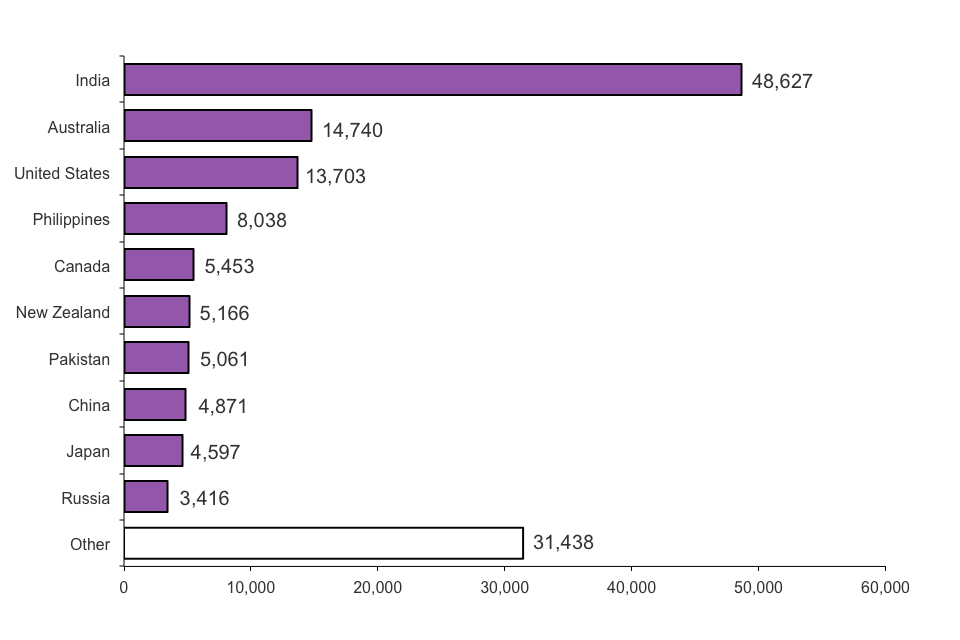
Chart notes
Source: Home Office, Immigration Statistics October to December 2013, Before entry table be 06 q w.
For 2012 data, the nationality breakdown for those granted extensions for work (see chart below) is in some respects different from the top 10 nationality rankings for admissions and for visas. Nigerian, Bangladeshis, Turkish and Sri Lankan nationals accounted for the fourth, seventh, eighth and tenth highest number of extensions for work.
The main explanation for the difference in the nationality breakdowns compared with work-related admissions and visas is that over half of the grants to Nigerian, Bangladeshi and Sri Lankan nationals were grants as high value individuals under the (Tier 1) Post-Study route. Since they originally entered via a study route, they are not prominent in the nationality rankings for work-related admissions and visas. Turkish nationals also have special provision to switch into the ‘work route’ under the European Community Association Agreement with Turkey.
Top 10 nationalities granted an extension to stay for work, 2012
(Total 94,549, excludes dependants)
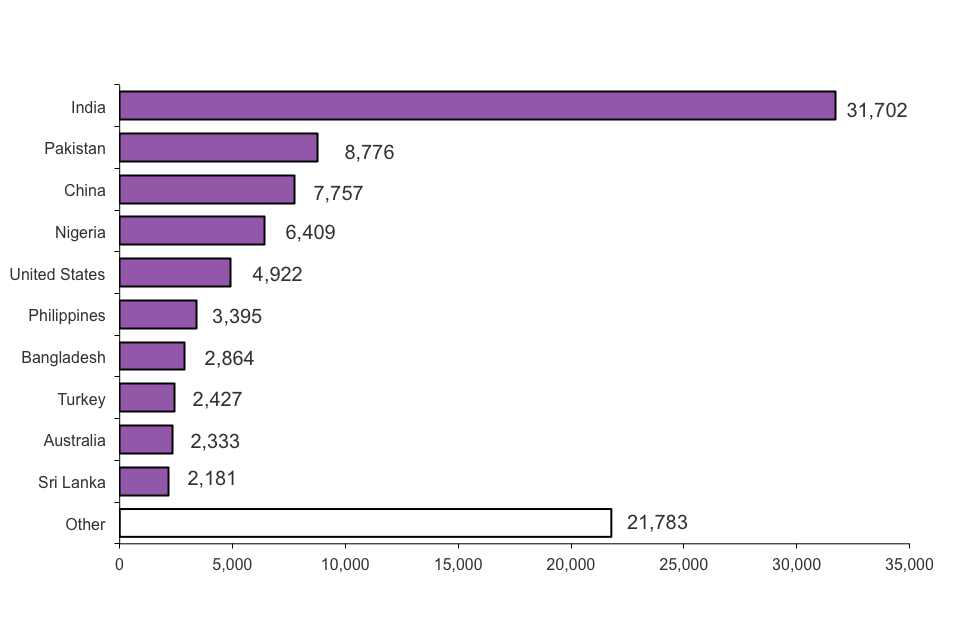
Chart notes
Source: Home Office, Immigration Statistics October to December 2013, Extensions table ex 02 w.
3.5 Permission to stay permanently (Settlement)
Some individuals who are admitted to the UK to work can become eligible to stay permanently after 5 years.
Work-related grants to stay permanently fell by 5% to 59,249 in 2013, continuing earlier falls from 84,347 in 2010. (see chart on long-term trends above). Before 2010, there had been a broadly rising trend in work-related grants of settlement that had partly reflected an increase in the number of people admitted in work categories 5 years earlier. The dip in the number of work-related grants in 2006 and 2007 reflects a change in the qualifying period from 4 to 5 years, delaying grants that would otherwise have occurred earlier.
The nationality profile for grants of permission to stay permanently in 2012, the latest available settlement data by nationality, differs slightly to the profile for grants of work visas in 2012, with 8 of the top 10 nationalities also in the top 10 nationalities issued with visas for work. A notable difference was South Africa, ranked second for permission to stay permanently, but not seen in the top 10 for visas. From detailed data in Settlement table se 03, the most common of the qualifying categories for South Africans was ‘Commonwealth citizens with a United Kingdom born Grandparent taking or seeking employment’ (accounting for 955 of the 2,404 grants).
3.6 Work-related sponsored visa applications
(Tier 2 skilled workers and Tier 5 youth mobility and temporary workers)
As part of the application process for visas and extensions for work reasons, main applicants must obtain a certificate of sponsorship from an employer. The Before entry tables cs 01 q to cs 06 q provide data on the number of employers registered and their sponsor rating, the nationality of main applicants, and the corresponding numbers of main applicants for different industry sectors.
Register of sponsors
An employer may be counted more than once in the total if registered separately to sponsor both Tier 2 and Tier 5 individuals or registered for more than one sub-Tier. Altogether there were 27,177 employers on the register on 2 January 2014, 4% more than on 2 January 2013 (26,179).
Skilled individuals (Tier 2)
There were 17% more sponsored visa applications (main applicants) from skilled individuals in 2013 compared with 2012 (from 40,740 to 47,835). The majority of the 47,835 certificates used related to the following sectors:
Information and Communication (20,171, up 15%),
Professional, Scientific and Technical Activities (8,569, up 17%),
Financial and Insurance Activities (5,875, up 10%),
Education (2,649, up 31%),
Manufacturing (2,554, up 10%).
In the same period there were 27% more sponsored extension applications (main applicants) from skilled individuals than in 2012 (from 27,815 to 35,195). The majority of the certificates related to the following sectors:
Information and Communication (6,774, up 14%),
Human Health and Social Work Activities (6,382, up 30%),
Professional, Scientific and Technical Activities (5,032, up 24%),
Education (4,005, up 29%),
Financial and Insurance Activities (3,629, up 24%).
Youth mobility and temporary workers (Tier 5)
There were 7% more sponsored visa applications (main applicants) from youth mobility and temporary workers compared with 2012 (from 40,296 to 43,209). The large majority of these 43,209 certificates related to the Arts, Entertainment and Recreation (30,713, up 4%) and Education (4,560, up 12%) sectors. There were a total of 554 sponsored applications for extensions for Tier 5, the relatively small numbers reflecting the rules relating to extensions for such workers.
3.7 Staying in the UK
The Migrant Journey Fourth Report reported that 33% of migrants issued with skilled work visas (with a potential path to settlement) in 2007 appear to have legally remained in the immigration system (9%) or have been granted permission to stay permanently (settlement) in the UK (25%) after 5 years (percentages may not sum to totals due to rounding).
The 33% of migrants issued with skilled work visas in the 2007 cohort who appear to have legally remained in the immigration system or have been granted permission to stay permanently after 5 years was a fall from 46% of such migrants in the 2004 cohort.
For people issued a skilled worker’s visa in 2004, 31% had gained settlement 5 years later, and a further 16% still had valid leave to remain in the UK.
Comparison of the 2004 cohort to the 3 subsequent cohorts indicates that there has been a rise in the proportion of people whose leave had expired after 5 years, from 54% in 2004 to 67% in 2007. This is reflected in the fall in the proportion of people from these cohorts who had valid leave to remain after 5 years, from 16% in 2004 to 9% in 2007. Some of this difference may be due to the increasing influence of the economic recession over the period analysed, which may have reduced the likelihood of some migrants choosing to remain longer in the later cohorts.
The proportion of skilled non-EEA workers who gained settlement after 5 years was similar for 2004, 2005 and 2006 (31%, 32% and 30% respectively) but was lower for the 2007 cohort (25%). Of the people issued a skilled workers visa in 2007, 38% had expired leave after 2 years.
Source: Home Office, Migrant journey: fourth report.
3.8 Data tables
Data on immigration for work, sourced from Home Office administrative systems, can be found in the following tables:
- Before entry: vol. 1 (tables cs 01 q to cs 06 q)
- Before entry: vol. 2 (tables be 01 q to be 05 q)
- Before entry: vol. 3 (tables be 06 q to be 06 q w)
- Before entry: vol. 4 (tables be 06 q s to be 08 q)
- Admissions (Tables ad 02 to ad 03 and ad 03 w)
- Extensions (Tables ex 01 to ex 02)
- Settlement (Tables se 01 to se 03)
4. Study
Valid: 27 February 2014 to 22 May 2014
4.1 Introduction
This section includes data for non-EEA nationals’ study-related visas issued outside the UK, including trends in applications for different education sectors, and non-EU nationals’ long-term immigration to study (i.e. those intending to stay for at least 12 months to study). It also includes data on study-related passenger arrivals (number of journeys), and extensions of stay in the UK for study.
4.2 Key facts
Study-related visas issued have risen 4% in 2013 (+9,024 to 218,773) compared with 2012.
There were 210,102 sponsored study visa applications (main applicants) in 2013, similar to 2012 (210,109). This included a 7% rise for the university sector (to 167,995), and falls for other sectors.
Non-EU long term immigration for study fell by 13% to 124,000 for the year ending September 2013, compared with the previous 12 months (143,000).
The 9,024 increase in study-related visas issued (excluding student visitors) includes higher numbers for Chinese (+5,227, +9%), Brazilian (+2,438, +147%) and Malaysian (+1,961, +24%) nationals. There were falls for other nationalities, including for Pakistan (-6,037, -55%) and India (-3,663, -21%).
There was also a 14% increase in student visitor visas issued, to 77,664 for the year 2013. Student visitors are normally only allowed to stay for up to 6 months (11 months for English Language schools) and cannot extend their stay.
Immigration for study: latest trends
| 2013 | 2012 | Change: latest 12 months | Percentage change | |
|---|---|---|---|---|
| Study-related visas issued (excl. Student visitors) | 218,773 | 209,749 | +9,024 | +4% |
| of which: | ||||
| General student (Tier 4) | 206,391 | 198,678 | +7,713 | +4% |
| Child student (Tier 4) | 12,296 | 10,967 | +1,329 | +12% |
| Student visitor visas | 77,664 | 68,351 | +9,313 | +14% |
| Year ending Sep 2013 | Year ending Sep 2012 | Change: latest 12 months | Percentage change | |
| Long-term immigration for study (1) | 124,000 | 143,000 | -19,000 | -13% |
Table notes
Source: Home Office, Immigration Statistics October to December 2013, Before entry table be 04 q, Office for National Statistics, Migration.
(1) Immigration for study data are estimates of the number of non-EU nationals intending to change their residence to the UK for at least 12 months based on the International Passenger Survey.
Long-term trends in student immigration
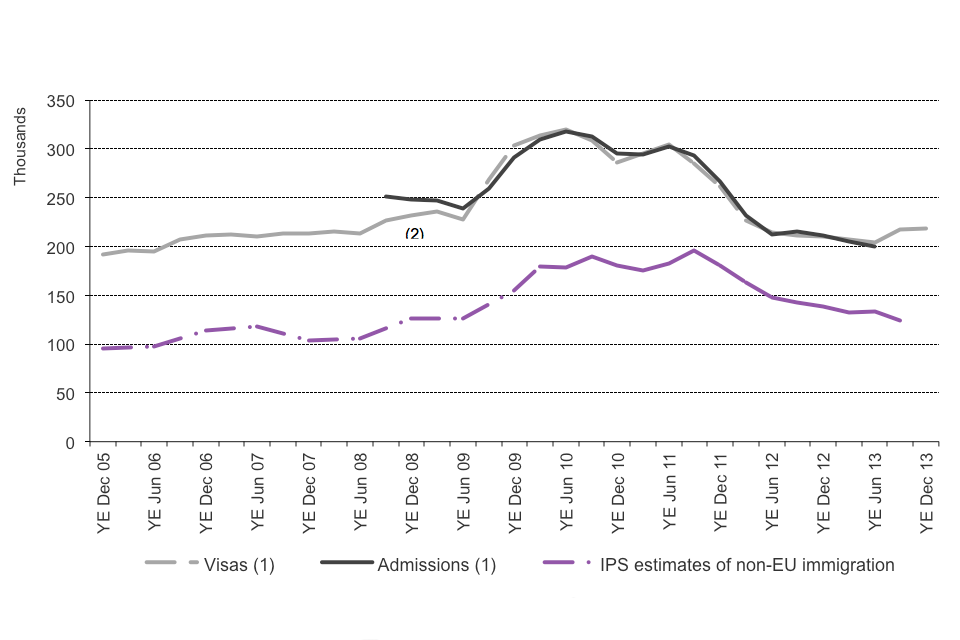
Chart notes
Source: Home Office, Immigration Statistics October to December 2013, Before entry tables be 04 q and Admissions table ad 02 q; Office for National Statistics, Migration.
(1) Excludes student visitors who are allowed to come to the UK for 6 months (or 11 months if they will be studying an English Language course) and cannot extend their stay.
(2) For periods prior to the year ending September 2008, the count of student admissions is not comparable as there was no specific admissions category for student visitors who may then have been recorded as either students or visitors.
The above chart shows that IPS long-term immigration estimates, while being substantially lower, follow a broadly similar trend to student visas issued and passenger arrivals, with steep increases in all three series during 2009 and a steep decrease from 2011. Two of the reasons why IPS estimates of students arriving are lower than figures for student visas issued or passenger arrivals are that the IPS figures exclude the many students who intend to stay for less than a year and dependants of those immigrating for the purposes of study.
Despite the general trend being similar, there are instances where the trends in visas issued, admissions and IPS estimates occasionally diverge. This apparent discrepancy is in part due to the potential for a margin of error that is inherent in sample surveys, together with possible changes in the proportion intending to stay for more than a year and the time difference between a visa being issued and the individual arriving.
4.3 Latest trends in study visas by nationality
The number of study-related visas issued (excluding student visitors) rose by 4% (+9,024) from 209,749 in the year ending December 2012 to 218,773 in the year ending December 2013. There were notable increases for Chinese (+5,227 or +9%), Brazilian (+2,438 or +147%) and Malaysian (+1,961 or +24%) nationals. There were some decreases for other nationalities, including falls of -6,037 (-55%) for Pakistan and -3,663 (-21%) for India.
Top 10 nationalities issued study visas (excluding student visitors), 2013
(Total 218,773)
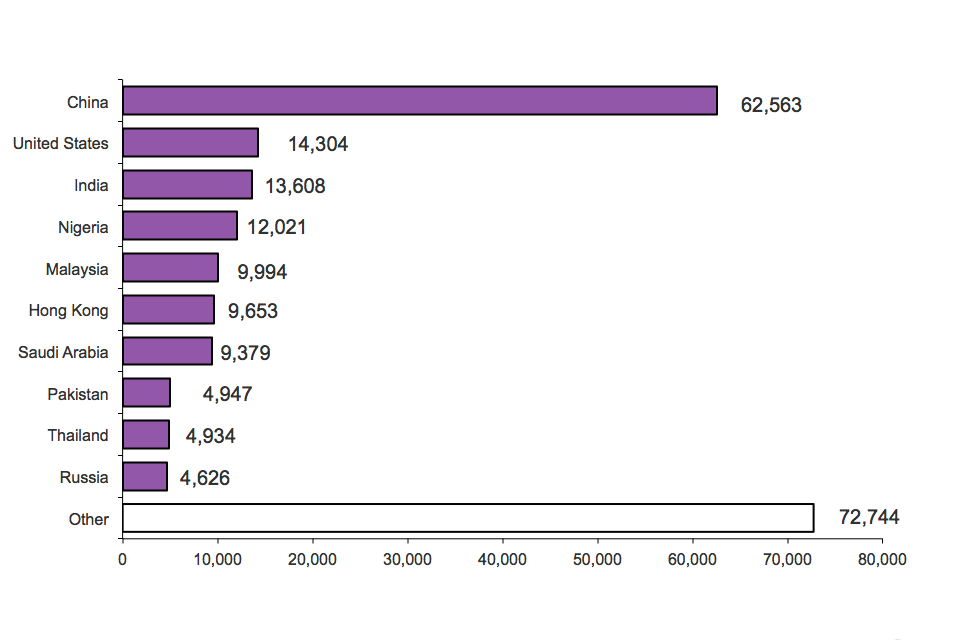
Chart notes
Source: Home Office, Immigration Statistics October to December 2013, Before entry table be 06 q s.
The top 10 nationalities accounted for over two-thirds (67%) of all study visas issued in 2013, with the top 5 nationalities (China, United States, India, Nigeria and Malaysia) accounting for over half (51%).
The number of study-related visas issued to Chinese nationals has increased steadily since the year ending December 2005 (18,977) and for the year ending December 2013 was at the highest level recorded (62,563) using comparable data.
By contrast the numbers of study-related visas (excluding student visitors) issued to Indian and Pakistani nationals have fallen since their peaks in the years ending June 2010 (68,238) and June 2011 (42,710) respectively.
4.4 Student visitors
Student visitors are issued with a visa for a maximum of 6 months in duration or in a very small number of cases for 11 months if studying an English language course. Student visitors are not counted as long-term migrants and cannot extend their stay, so they are not included within the references to study visas in this section.
In 2013, 77,664 student visitor visas were issued, 14% more (+9,313) than in 2012. Most of the 9,313 increase related to European nationals (+3,610) and Asian nationals (+2,494), with increases for Chinese (+1,766), Turkish (+1,459), Libyan (+1,053) and Russian (+1,021) nationals. The number of visas issued to student visitors has increased steadily since the category was introduced in September 2007.
The increase in study visas issued to Libyans is consistent with a return to previous levels, following civil unrest in Libya. However, Libyans still account for a very small fraction of the total. In 2013, visas issued to Libyan nationals represented 1% (3,143) of all study visas and 4% (2,776) of all student visitor visas issued.
Top 10 nationalities issued student visitor visas, 2013
(Total 77,664)
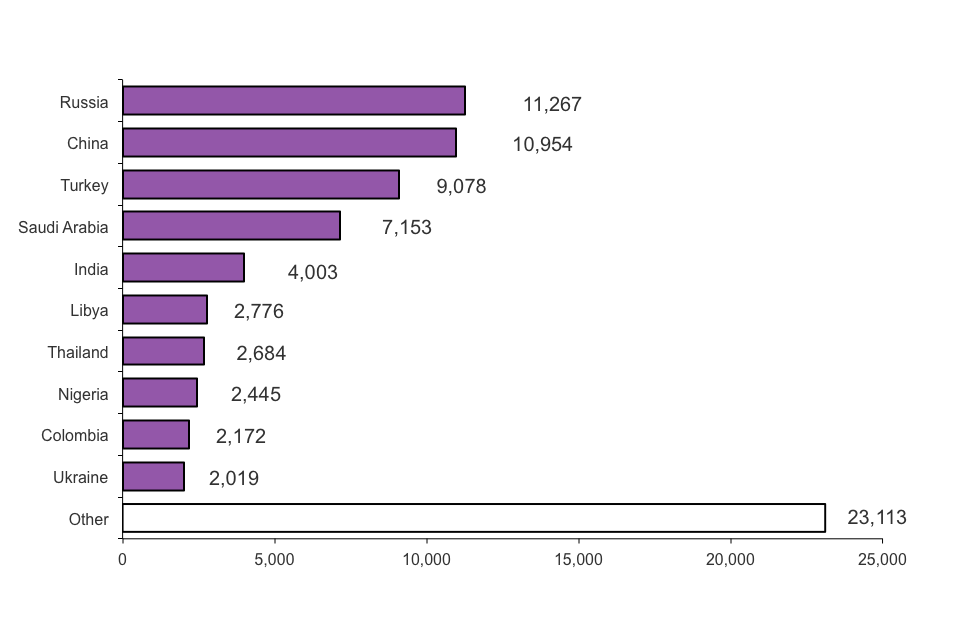
Chart notes
Source: Home Office, Immigration Statistics October to December 2013, Before entry table be 06 q s.
The top 10 nationalities in the chart above accounted for over two-thirds (70%) of the 77,664 student visitor visas issued in 2013.
There were 266,000 student visitor admissions in the 12 months up to and including June 2013, much higher than student visitor visas issued (72,496 over the same period). This is largely due to many of the top 10 nationalities for student visitor admissions are non-visa nationalities (including the United States and Brazil). Such nationals do not need to obtain a visa if they wish to come to the UK as a student visitor for up to 6 months and so are included in the admissions data but not the visas data.
4.5 Admissions
There were 6% (-12,600) fewer study-related admissions (excluding student visitors) in the year ending June 2013 (200,000) than in 2012.
4.6 Immigration for study
In the year ending September 2013, there were an estimated 124,000 non-EU long-term study-related migrants, 13% fewer than in the previous 12 months (143,000).
Source: ONS, Long-Term International Migration.
4.7 Extensions of stay
There was a 34% increase in study-related grants of extensions in 2013 (116,423) compared with 2012 (87,073). This followed a 38% fall from 140,151 in 2010 to 87,073 in 2012. As discussed below, this 34% increase in study-related grants of extensions in 2013 corresponded to a 36% increase in sponsored applications for extensions, with the highest increase for the university sector (which rose 50%).
Note that student visitors are normally only allowed to stay for up to 6 months (11 months for English language schools) and cannot extend their stay.
The study-related grants of extensions in 2013 included 561 grants under the new Tier 4 Doctorate Extension Scheme (the new scheme was introduced on 6 April 2013.)
4.8 Study-related sponsored visa applications (students (Tier 4))
On 2 January 2014 there were 1,706 educational institutions on the UK Visas and Immigration register of sponsoring educational institutions. Although this was similar to the number on 30 September 2013 (1,708), it was 10% lower than a year earlier (2 January 2013, 1,898) which continues the falls seen since the published series began in October 2011 (2,370).
The decrease in the number of sponsoring educational institutions is consistent with the introduction of new accreditation criteria and conditions of status for educational sponsors from April 2011.
Study-related sponsored visa applications by sector
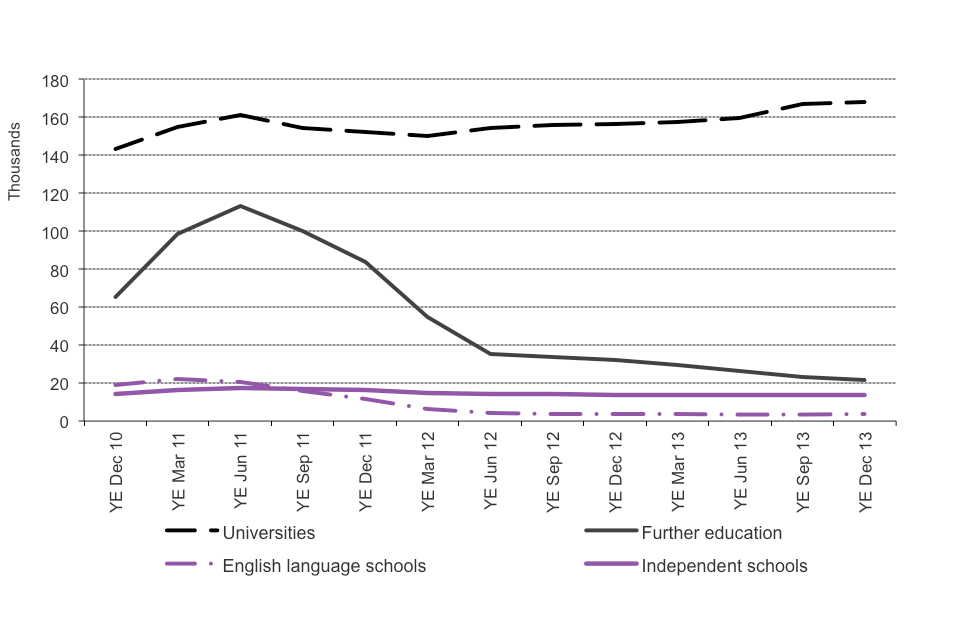
Chart notes
Source: Home Office, Immigration Statistics October to December 2013, Before entry table cs 09 q
‘Universities’ relate to UK-based Higher Education Institutions.
‘Further education’ relates to tertiary, further education or other colleges.
There were a similar number of study-related sponsored visa applications (main applicants) in 2013 (210,102) compared with 2012 (210,109). This included different trends for different sectors. In particular there was a 7% rise in sponsored visa applications for the university sector (to 167,995), and falls in the further education sector (to 21,442, -34%), English language schools (to 3,532, -2%) and independent schools (to 13,617, -2%).
There were 108,021 sponsored applications for extensions (main applicants) in 2013, 36% more than in 2012, but, again, the change was not uniform across the education sectors. There were 50% more sponsored applications for extensions in the university sector (to 69,093), along with increases in the further education sector (to 33,018, +17%) and independent schools (to 2,539, +18%). By contrast there were 28% fewer sponsored applications for extensions for English language schools (to 1,263).
4.9 Staying in the UK
The Migrant Journey Fourth Report reported that 15% of migrants issued student visas in 2007 appear to have legally remained in the immigration system or settled in the UK after 5 years. After 5 years 14% had some form of valid leave to remain and 1% had been granted permission to stay permanently (settlement).
Comparison of the 4 cohort years suggests that there has been a sizable fall in the proportion of student migrants who still had valid leave to remain in the UK 5 years after their arrival, or who had achieved permanent settlement in the UK, from 23% in the 2004 cohort to 15% in the 2007 cohort. This is consistent with the tightening of the Immigration Rules for students since September 2007.
Source: Home Office, Migrant journey: fourth report.
4.10 Data tables
Data on student immigration, sourced from Home Office administrative systems, can be found in the following tables:
- Before Entry vol. 1: Tables cs 07 q to cs 14 q
- Before Entry vol. 2: Tables be 01 q to be 05 q
- Before Entry vol. 3: Tables be 06 q to be 06 q w
- Before Entry vol. 4: Tables be 06 q s to be 08 q
- Admissions: Tables ad 02 to ad 03 and ad 03 s
- Extensions: Tables ex 01 to ex 02 s
Tables cs 13 to cs 14 q provide new data on sponsored visa applications and sponsored applications for extensions for the university sector broken down by nationality.
The Office for National Statistics publishes data on student immigration, migration.
5. Family
Valid: 27 February 2014 to 22 May 2014
5.1 Introduction
This topic focuses on non-EEA nationals who come to the UK for family reasons. Data on visas, admissions to the UK, extensions of stay, settlement and estimates of immigration for family reasons from the International Passenger Survey (IPS) are used to explore immigration for family reasons.
There are a number of ways that people can come to the UK for family reasons. The traditional ‘family route’ – where people come to join or accompany family members who are either British citizens or settled in the UK, as ‘visitors’ – where people come for a short time to visit family members, or as ‘other dependants joining or accompanying’ – where people come as dependants of migrants, for example those working or studying in the UK.
The data presented in this topic differentiate between those immigrating to the UK via the ‘family route’ and those coming as ‘other dependants joining or accompanying’ migrants. ‘Visitors’ are excluded from the analysis.
Following a consultation on family migration, a number of changes to the Immigration Rules came into effect in July 2012. Within this analysis it is not possible to separately identify applications made under the previous or new rules. However, it is likely that changes to the Immigration Rules have impacted on the figures. Details of these changes, and more information on the ways that people can come to the UK for family reasons, are included in the family section of the user guide.
5.2 Key facts
In 2013, 33,690 family route visas were issued. This is a decrease of 18% compared with 2012 (40,892) and is the lowest number of family route visas issued since comparable records began in 2005. There was a 9% increase in the number of visas issued to other dependants joining or accompanying migrants in the UK (76,742) compared with the previous 12 months (70,633).
The proportion of resolved family route visa applications that were refused was 34%. This compares with 27% in 2012.
There were 40,670 extensions of stay for family reasons in 2013. Of this total, 22,384 (55%) were granted under the spouse category and 18,167 (45%) were granted under the new Family Life (10 year) category. There were also 59,638 grants of settlement in the UK for family formation and reunion reasons, an increase of 26% from the previous 12 months. Two thirds of grants of settlement for family reasons were for spouses (50,256; 84%).
In the year ending September 2013 (the latest data available), the IPS estimated that 40,000 non-EU nationals immigrated to the UK to accompany or join others, with the intention of staying for a year or more. This is a similar level compared with the previous year (41,000).
Family immigration – latest trends
| 2013 | 2012 | Change: latest 12 months | Percentage change | |
|---|---|---|---|---|
| Family-related visas issued | 33,690 | 40,892 | -7,202 | -18% |
| of which: | ||||
| Partners | 24,641 | 31,508 | -6,867 | -22% |
| Children | 3,917 | 4,086 | -169 | -4 |
| Other Dependants | 5,132 | 5,298 | -166 | -3% |
| All other dependants (excl. Visitors visas) | 76,742 | 70,633 | +6,109 | +9% |
| Year ending Sep 2013 | Year ending Sep 2012 | Change: latest 12 months | Percentage change | |
| Long-term immigration to accompany or join others (1) | 40,000 | 41,000 | -1,000 | -3% |
Table notes
Source: Home Office, Immigration Statistics October to December 2013, Before entry table be 01 q, Office for National Statistics.
(1) Latest 12 months for visas issued data is to 2013. Latest 12 months for long-term immigration to accompany or join others data is the year ending September 2013.
5.3 Long-term trends in family immigration
IPS estimates of non-EU immigration of those accompanying or joining others in the UK include those arriving on family visas, as well as persons accompanying those who are arriving for other reasons, such as for work or study. In the year ending September 2013, IPS estimates show that 40,000 non-EU nationals immigrated to the UK for family reasons.
The chart below shows that IPS estimates of immigration for family reasons follow a broadly similar trend to the total visas issued through the family route and to other dependants, although IPS estimates are substantially lower. A reason for this is that the IPS figures exclude the many people who come to the UK but intend to stay for less than a year; visa figures would include these people. These measures of immigration for family reasons showed a general downward trend since March 2007, including a steeper decline since the year ending June 2011. Recently, family visas have continued to show falls, whilst visas issued to other dependants have shown a small increase.
The trend for IPS estimates appears to be similar to figures for family visas alone; however, this is coincidental given the IPS category includes all migrants intending to stay for a year or more who describe their main reason for migration as to ‘accompany or join’, regardless of the type of visa they hold (so this would tend to include dependents of those arriving).
Long-term trends in family immigration
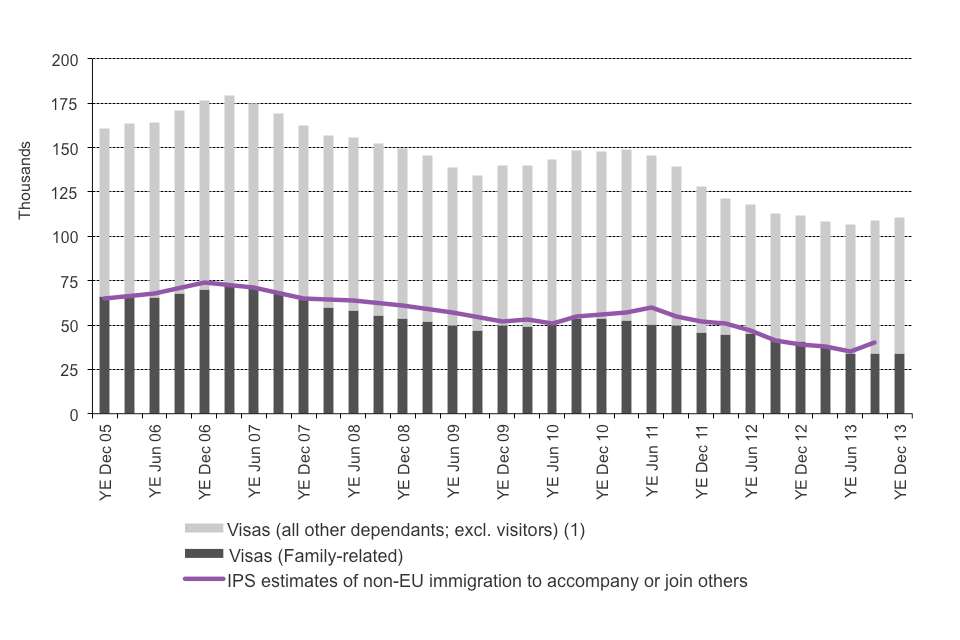
Chart notes
Source: Home Office, Immigration Statistics October to December 2013, Before entry table be 04 q; Office for National Statistics, migration.
(1) Includes all dependants (e.g. dependants for work and study), but excludes visitors.
Despite the general trends being similar, there are instances, visible from the chart above, where the trend in family visas issued and IPS estimates of non-EU immigration to accompany or join others appear to be slightly different. It is possible that these differences can be accounted for by the inherent variability associated with sample surveys. There is also the possibility that people intending to stay in the UK for a year or more, or who are arriving for family reasons, do not state this when interviewed for the IPS. It is also expected that there will be a time lag between an application for a visa and the person arriving in the UK, and that this will feature in the IPS estimates.
5.4 Visas
In 2013, 33,690 family-related visas were issued. This is a decrease of 18% compared with 2012 (40,892).
Nationalities with the highest number of visas issued for family reasons in 2013 were Pakistan (12%), India (10%), United States (6%), Nepal (5%) and Philippines (4%). Of these nationalities, Pakistan and Nepal showed the biggest decreases compared with 2012 (-47% and -34% respectively). There were smaller decreases for India (-5%) and the Philippines (-14%) and a 1% increase for the United States.
Of the total visas issued for family reasons, 24,641 (73%) were issued to partners, 3,917 (12%) were issued to children and 5,132 (15%) were issued to other dependants. Compared with 2012, the number of family visas issued to partners fell by 22%; visas issued to other dependants and children fell by 4% and 3% respectively.
A visa application is resolved when a visa has been issued, refused or withdrawn, or when an application has lapsed. In 2013, 34% of resolved family-related visa applications were refused. This compares with 27% in 2012. The recent increase coincides with recent changes to the family Immigration Rules in July 2012. However, it is not possible to separately identify whether decisions made on or after 9 July 2012 relate to applications made under the previous or new rules.
Other dependants can be issued with a visa to join or accompany migrants who have not been granted the right to stay permanently in the UK. In 2013, 76,742 of these visas (excluding visitors) were issued, an increase of 9% compared with the previous 12 months (70,633). Of the 76,742 visas issued, 60% (45,928) were issued to other dependants of workers, 25% (19,056) to other dependants of students and 15% (11,758) to other dependants accompanying or joining a migrant in the UK.
Despite the increase in visas issued to other dependants joining or accompanying migrants (+9%), the level is over a quarter lower than the peak of around 107,000 in the year ending March 2007 (Table be 01 q). There was a sharp decrease in the number of visas issued to dependants coming to the UK between the year ending June 2011 and the year ending December 2012 and this was, in part, consistent with changes to the rules governing visas issued to those coming to the UK for work or study and their dependants, from December 2010 and April 2011 respectively.
5.5 Admissions
Admissions for family reasons fell to 22,960 in the year ending June 2013 (compared with 29,510 in the previous 12 months), continuing the overall trend since 2006.
5.6 Immigration for family reasons
The IPS estimate for non-EU nationals accompanying or coming to join family or friends for a year or more was 40,000 in the year ending September 2013. This is similar to the 41,000 issued in the previous 12 months (-3%; not a statistically significant change).
Source: ONS, Long-Term International Migration.
5.7 Extensions of stay
Statistics on extensions of stay relate to people wishing to extend or change the status of their stay in the UK. One of the ways that people can do this is for family reasons, and main applicants and dependants can apply under fiancé(e), spouse, UK-born children, other relative categories and the new Family Life (10 year) route (where partners and parents who apply in the UK are granted leave to remain on a 10-year route to settlement on the basis of their family life – further information is given in the extensions topic.
In 2013 there were 40,670 grants of extension for family-related reasons. This is an increase of 24,043 compared with the previous 12 months, which follows year-on-year decreases in each of the previous 3 years.
Of the total extensions for family reasons, 22,384 (55%) were granted under the spouse category and 18,167 (45%) were granted under the Family Life (10 year) route. Relatively few extensions of stay were granted under the UK-born children, fiancé or other relative categories (119; 0%).
The large increase in the number of grants of extensions of stay for family reasons is partly due to a 61% increase in those granted to spouses (from 13,895 to 22,384) and partly due to the introduction of the new Family Life (10 year) route. Over 40% of the 22,384 grants of extensions to spouses during 2013 were made in the first quarter. This may reflect additional resource deployed to decision-making at the beginning of 2013.
As well as an increase in the number of grants of extensions of stay, there has also been an increase in the number of refusals of family-related extensions of stay. Refusals of family-related extensions rose from 2,093 in 2012 to 17,198 in 2013 (30% of all decisions). This was accounted for by an increase in refusals to spouses (1,822 to 6,048) and refusals under the new Family Life (10-year) route (11,140 in 2013).
Other dependants of migrants who have not been granted the right to stay permanently in the UK, for example workers and students, can also apply to extend their stay in the UK. In 2013, 69,678 extensions were granted to dependants, an increase of 6,430 (+10%) from the previous 12 months.
5.8 Settlement
There were 59,638 grants of settlement in the UK for family formation and reunion reasons in 2013, an increase of a quarter (+26%) from the previous 12 months. This number is around 10,000 lower than the peak of around 70,000 in 2009.
The majority of settlement grants were for spouses (50,256; 84%), with the remainder for children (6,880; 12%), parents and grandparents (703; 1%) and other or unspecified dependants (1,799; 3%).
The increase in grants of settlement for family reasons was driven by a 34% (+12,857) increase in the number of spouses granted settlement. The increase in the number of children granted settlement was small (+844) and there was small decreases in the number of parents, grandparents and other or unspecified dependants granted settlement (-1,437).
5.9 Staying in the UK
Analysis undertaken for the Migrant Journey Fourth Report showed that 67% of migrants issued family visas in 2007 appear to have legally remained in the immigration system after 5 years. Of these, 3% had some form of valid leave to remain and 64% had achieved settlement. This is an increase from 2004 when 60% of migrants issued family visas appeared to have legally remained in the UK. Source: Home Office, Migrant journey: fourth report.
5.10 Data tables
Data on family immigration, sourced from Home Office administrative systems, can be found in the following tables:
- Before entry volume 2: tables be 01 q to be 04 q
- Before entry volume 4: table be 06 q f
- Admissions: tables ad 02 to ad 03 f
- Extensions: tables ex 01 to ex 02 f
- Settlement: tables se 01 to se 04
The Office for National Statistics publishes estimates of those coming to join or accompany others, migration.
6. Before entry
Valid: 27 February 2014 to 22 May 2014
6.1 Introduction
The figures in this section relate to applications for and issue of entry clearance visas, and passengers refused entry at ports.
6.2 Key facts
There were 532,574 visas issued in 2013, excluding visitor and transit visas, 5% (+25,034) higher than in 2012. This increase was largely accounted for by higher numbers of work (+9,750), study (+9,024) and student visitor visas (+9,313), partly offset by a fall in family visas (-7,202).
The number of student visitor visas issued continued to increase, reaching 77,664 in 2013 (+14%). Student visitor visas are issued for short-term study (typically for 6 months) and cannot be extended.
There were 1,941,161 visitor visas issued in 2013, 14% higher (+245,093) than in 2012. Much of the increase was accounted for by higher numbers issued to Chinese (+81,575 or +39%), Russian (+35,658 or +21%), Kuwaiti (+25,324 or +42%), Indian (+17,973 or +6%) and Saudi Arabian (+15,227 or +20%) nationals.
The number of passengers refused entry at port rose by 5% to 16,292 in 2013.
Visas issued by reason (excluding visitor and transit visas)
| Total issued (1) | Work | Study | Student visitors (2) | Family | Dependant joining or accompanying | Other | |
| 2008 | 584,176 | 184,711 | 231,975 | 42,238 | 53,544 | 41,460 | 30,248 |
| 2009 | 597,450 | 155,691 | 303,361 | 37,703 | 49,472 | 17,480 | 33,743 |
| 2010 | 596,966 | 160,737 | 285,544 | 49,191 | 53,713 | 15,357 | 32,424 |
| 2011 | 564,807 | 149,310 | 261,870 | 61,406 | 45,723 | 14,155 | 32,343 |
| 2012 | 507,540 | 145,110 | 209,749 | 68,351 | 40,892 | 11,700 | 31,738 |
| 2013 | 532,574 | 154,860 | 218,773 | 77,664 | 33,690 | 11,758 | 35,829 |
| Change: latest year | +25,034 | +9,750 | +9,024 | +9,313 | -7,202 | +58 | +4,091 |
| Percentage change | +5% | +7% | +4% | +14% | -18% | 0% | +13% |
Long-term trends in visas issued by reason (excluding visitor and transit visas)
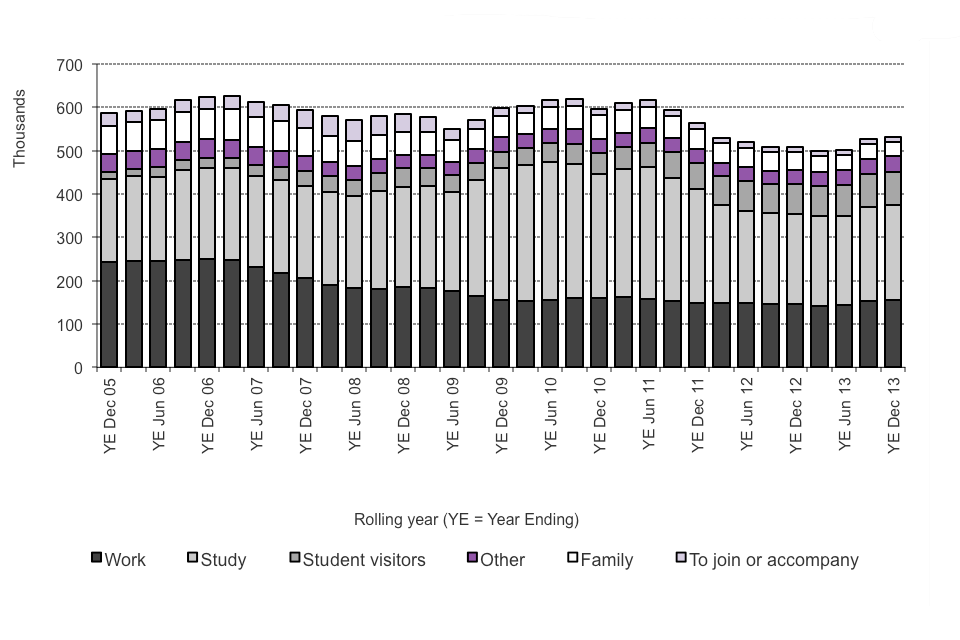
Table and chart notes
Source: Home Office, Immigration Statistics October to December 2013, based on data in Before entry table be 04 q, Before entry vol. 2.
(1) Figures exclude visitor and transit visas.
(2) The student visitor category was introduced in September 2007. Student visitors are allowed to come to the UK for 6 months (or 11 months if they will be studying an English Language course) and cannot extend their stay. The data includes those who applied on the ‘Short-term student’ endorsement prior to the introduction of the student visitor category. For consistency and comparability over time student visitor visas have been excluded from study-related totals. For further discussion of study and student visitors see the study section.
The falls in work, study and family visas issued since 2010 are consistent with policy changes which came in to effect from the end of 2010. The latest increases for work and study may reflect increased levels of applications for particular industry and educational sectors. Detailed briefing on the trends of visas issued for work, study or family reasons (together with dependants joining or accompanying) are available in the work, study and family sections.
6.3 Visas issued by nationality
There were 532,574 visas issued in 2013, excluding visitor and transit visas, 25,034 higher than in 2012 (507,540).
The increase included higher numbers of visas issued for Chinese (+6,593 or +9%), United States (+2,888 or +9%), Brazilian (+2,560 or +65%) and Libyan (+2,522 or +67%) nationals. The increase for Libyan nationals suggests that the levels are continuing to return to those seen prior to the start of civil unrest in the country.
Over half of these visas issued in 2013 were to Asian nationals (52% or 275,709) with a further quarter issued to American nationals (13% or 68,111) and African nationals (12% or 62,564). The following map illustrates that four of the top ten nationalities issued visas in 2013 were Asian (China, India, Pakistan, Malaysia), two European (Russia, Turkey), and one nationality each from the Americas (USA), Oceania (Australia), Africa (Nigeria) and the Middle East (Saudi Arabia).
The top ten nationalities accounted for 60% of the total. Chinese nationals were issued the highest number of visas in 2013 (81,171, 15%), followed by Indian nationals (79,161, 15%) and United States nationals (36,827, 7%). China excludes Hong Kong.
Top 10 nationalities issued visas in 2013
(Total 532,574, excluding transit and visitor visas)
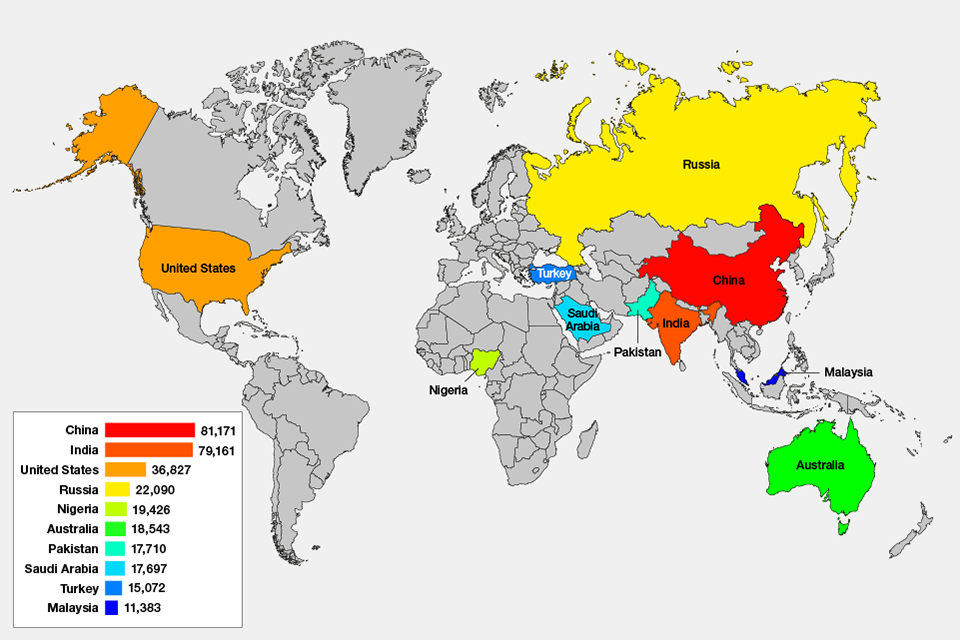
Chart notes
Source: Home Office, Immigration Statistics October to December 2013, Before entry table be 06 q, Before entry vol. 3.
(1) China excludes Hong Kong.
6.4 Visas issued by reason and nationality
The number of work-related visas issued fell between 2010 and 2012. Since then, the levels have increased from 145,110 to 154,860 in 2013. Nearly three quarters of the increase from 2012 to 2013 (+9,750) was accounted for by higher numbers for Indian (+4,971, +10%), United States (+1,256, +9%) and South Korean (+884, +54%) nationals.
The number of study visas issued increased from 191,584 in 2005 to a peak of 320,183 in the year ending June 2010 and then fell to 204,469 in the year ending June 2013. The number then rose to 218,773 in the year ending December 2013, an increase of 9,024. This 9,024 (+4%) increase included higher numbers issued to Chinese (+5,227, +9%), Brazilian (+2,438, +147%) and Malaysian (+1,961, +24%) nationals. There were large falls in study visas issued to Pakistani (-6,037, -55%) and Indian (-3,663, -21%) nationals.
There was a 9,313 (+14%) increase in student visitor visas issued, including higher numbers to Chinese (+1,766, +19%), Turkish (+1,459, +19%), Libyan (+1,053, 61%) and Russian (+1,021, +10%) nationals.
There were increases in the number of study visas (+1,358) and student visitor visas (+1,053) issued to Libyan nationals, which suggest there was a continuing return to previous levels, following civil unrest in Libya, although they remain a very small share of the total (1% and 4% of study and student visitor visas issued, respectively).
After reaching a peak of 72,894 in the year ending March 2007, family visas issued have continued to decrease, falling by 18% in 2013 (-7,202, to 33,690). In 2013 the largest falls were for Pakistani (-3,531, -47%), Bangladeshi (-927, -45%), Nepalese (-810, -34%), Jamaican (-299, -40%) and Afghan (-287, -30%) nationals. There was an increase for Syrian nationals (more than tripling from 201 to 693), which is consistent with continuing civil unrest in Syria since early 2011.
There were 1,941,161 visitor visas issued in 2013, 14% higher (+245,093) than the previous year. This increase was in large part due to higher numbers issued to Chinese (+81,575 or +39%), Russian (+35,658 or +21%), Kuwaiti (+25,324 or +42%), Indian (+17,973 or +6%) and Saudi Arabian (+15,227 or +20%) nationals. By contrast, the largest falls were in visas issued to nationals of South Africa (-6,276 or -7%), Ghana (-3,432 or -17%) and Jamaica (-689 or -13%).
6.5 Data tables
Further data on entry clearance visas and passengers refused entry at port can be found in:
- Before entry vol. 2: tables be 01 q to be 05 q
- Before entry vol. 3: tables be 06 q and be 06 q w
- Before entry vol. 4: tables be 06 q s to be 08 q.
Before entry vol. 1: tables cs 01 to cs 14 q provide data on sponsored visa applications for the work and study routes (both of which are described further in the work and study topics).
7. Admissions
Valid: 27 February 2014 to 22 May 2014
7.1 Introduction
The figures in this section relate to the number of journeys made by people entering the UK. Where an individual enters the country more than once, each arrival is counted. For non-EEA nationals who are subject to immigration control, more detailed information is available on their nationality and purpose of their journey.
Total passenger arrival data are available up to the end of 2013; data on the purpose of journey (e.g. visit, work, study) to the year ending June 2013; and data for individual nationalities are available up to the end of 2012.
7.2 Key facts
The total number of journeys increased by 4% to 111.1 million in 2013 compared with 106.7 million in 2012.
The higher number of journeys in 2013 (up 4.3 million) was accounted for by 3.5 million more journeys by British, other EEA and Swiss nationals (totalling 97.3 million) and 0.9 million more journeys by non-EEA nationals (13.8 million).
For non-EEA nationals more detailed data by category is less up to date than the totals and does not yet show a comparable increase. Instead it was broadly flat for the year ending June 2013 (13.0 million journeys or a fall of 1%). There was a slight increase in the work category (+1% or +1,730) and falls for the study (-6% or -12,600), student visitor (-10% or -29,700) and family (-22% or -6,570) categories. The number of visitors increased by 2% (+0.2 million).
Admissions by purpose of journey – non-EEA nationals
| Year | Total admissions (Millions) | Work | Study | Student visitors (1) | Family | Visitors (Millions) | Other (Millions) |
|---|---|---|---|---|---|---|---|
| Year ending June 2009 | 12.1 | 175,000 | 239,000 | 158,000 | 40,900 | 6.7 | 4.8 |
| Year ending June 2010 | 12.4 | 159,000 | 320,000 | 227,000 | 35,400 | 6.9 | 4.8 |
| Year ending June 2011 | 13.1 | 161,000 | 303,000 | 246,000 | 36,100 | 7.6 | 4.8 |
| Year ending June 2012 | 13.2 | 142,000 | 212,000 | 295,000 | 29,500 | 7.8 | 4.7 |
| Year ending June 2013 | 13.0 | 144,000 | 200,000 | 266,000 | 22,900 | 8.0 | 4.4 |
| Change: latest year | -0.2 | 1,730 | -12,600 | -29,700 | -6,570 | +0.2 | -0.3 |
| Percentage change | -1% | +1% | -6% | -10% | -22% | +2% | -7% |
Table notes
Source: Home Office, Immigration Statistics October to December 2013, Admissions table ad 02 q.
(1) Student visitors are allowed to come to the UK for 6 months (or 11 months if they will be studying an English Language course) and cannot extend their stay. The student visitor category was introduced in 2007 and may include individuals previously recorded as visitors, so for consistency and comparability over time they have been excluded from study-related totals. For further discussion of study and student visitors see the study section.
Long-term trends in admissions
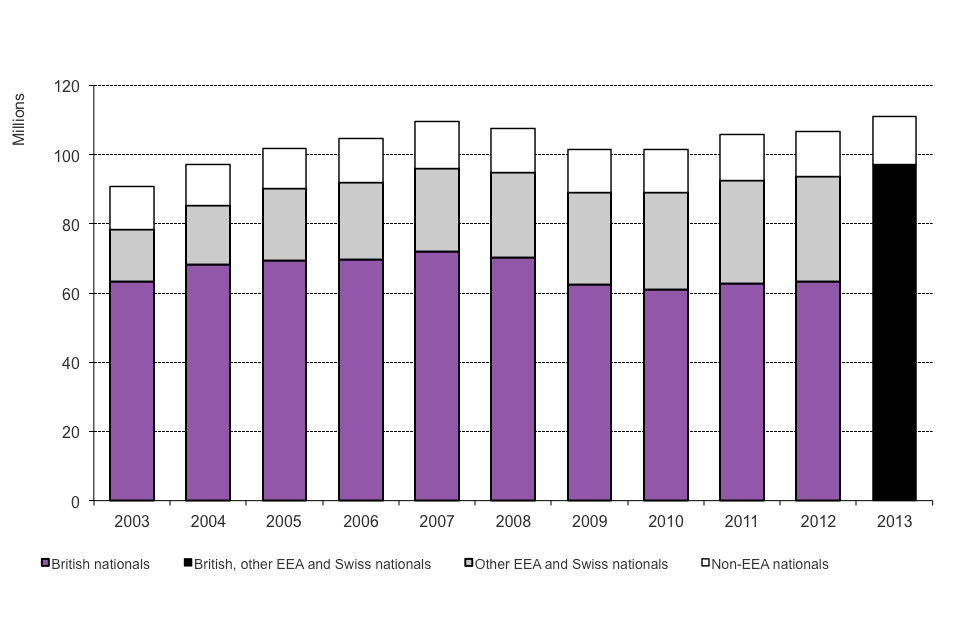
Chart notes
Data showing British nationals and other EEA and Swiss nationals separately for 2013 will be available in May 2014.
Source: Home Office, Immigration Statistics October to December 2013, Admissions table ad 01.
7.3 Non-EEA nationalities admitted to the UK, 2012
United States nationals accounted for more than a quarter (28%) of the 12.9 million journeys by non-EEA nationalities into the UK. The top 10 nationalities accounted for 69% of all journeys made.
Top 10 nationalities admitted, 2012
(Total number of admissions 12.9 million)
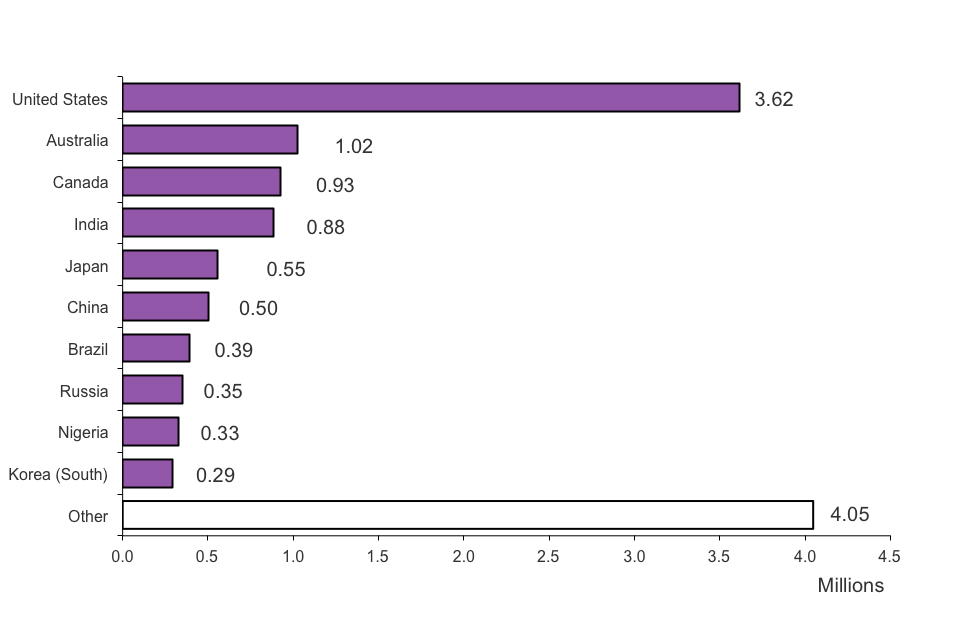
Chart notes
Source: Home Office, Immigration Statistics October to December 2013, Admissions table ad 03.
7.4 Data tables
Further data are available in Admissions tables ad 01 to ad 03.
8. Asylum
Valid: 27 February 2014 to 22 May 2014
8.1 Introduction
This section covers asylum applications, initial decisions, unaccompanied asylum-seeking children (UASCs), age disputes, support, resettlement and international comparisons.
8.2 Key facts
There were 23,507 asylum applications in 2013, a rise of 1,664 (+8%) compared with 2012. The number of applications remains low relative to the peak number of applications in 2002 (84,132), and similar to levels seen since 2006 (23,608).
The number of initial decisions on asylum applications has increased by 5% to 17,647 in 2013. Of these decisions, 37% (6,542) were grants of asylum, a form of temporary protection or other type of grant.
At the end of 2013, 17,180 of the applications for asylum received since April 2006 from main applicants were pending a decision (initial decision, appeal or further review). This was 21% more than at the end of 2012.
The HM Courts and Tribunals Service received 8,512 asylum appeals from main applicants in 2013, a rise of 4% compared with 2012.
At the end of December 2013, 23,459 asylum seekers were being supported while their asylum claim was finally determined (under Section 95). The number of failed asylum seekers and their dependants receiving support (under Section 4) was 4,831.
Asylum applications and initial decisions for main applicants
| Year | Total applications | Total Initial decisions | Granted (1) | Granted as a % of initial decisions | Refused | Refused as a % of initial decisions |
|---|---|---|---|---|---|---|
| 2009 | 24,487 | 24,287 | 6,742 | 28% | 17,545 | 72% |
| 2010 | 17,916 | 20,261 | 5,195 | 26% | 15,066 | 74% |
| 2011 | 19,865 | 17,380 | 5,649 | 33% | 11,731 | 67% |
| 2012 | 21,843 | 16,774 | 6,059 | 36% | 10,715 | 64% |
| 2013 | 23,507 | 17,647 | 6,542 | 37% | 11,105 | 63% |
| Change: latest year | +1,664 | +873 | +483 | - | +390 | - |
| Percentage change | +8% | +5% | +8% | - | +4% | - |
Table notes
Source: Home Office, Immigration Statistics October to December 2013, Asylum table as 01.
(1) Granted includes grants of asylum, humanitarian protection, discretionary leave, leave to remain under family life or private life rules, leave outside the rules and UASC leave.
Most applications for asylum are made by those already in the country (88% of applications in 2013) rather than by people arriving at port. Applicants tend to be young and male. Of those who applied for asylum in 2012, over half (57%) were between the ages of 18 and 39, and 72% were male. Figures for 2013 broken down by sex and age are to be published in August 2014.
2013 saw the highest proportion of grants of asylum, a form of temporary protection or other type of grant (37%, 6,542) since 1993.
Long-term trends in asylum applications
The chart below shows the annual number of asylum applications made since 2001.
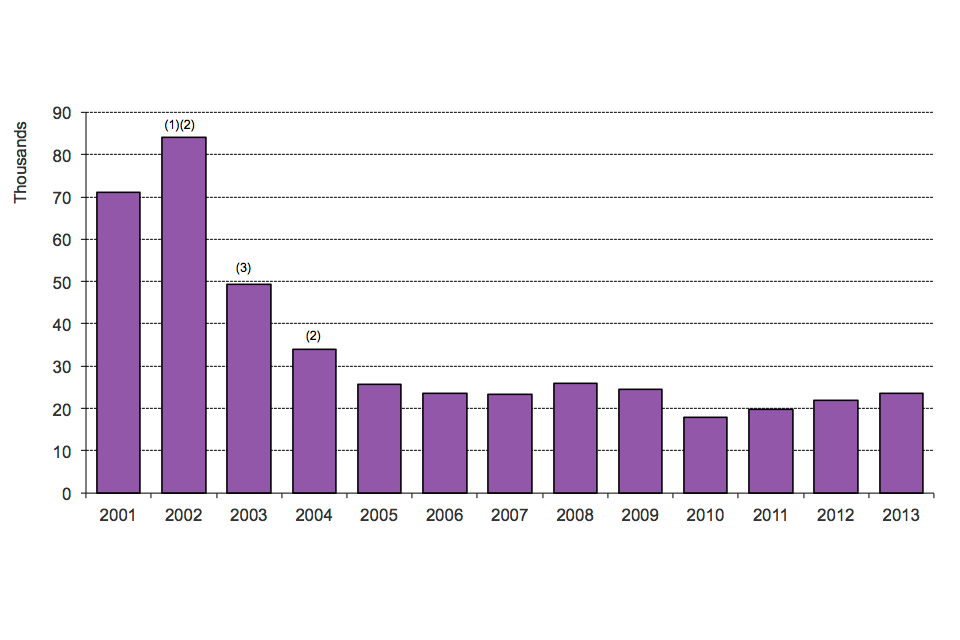
Chart notes
Source: Home Office, Immigration Statistics October to December 2013, Asylum table as 01.
(1) A process preventing certain nationalities from appealing a decision while in the country (non-suspensive appeals process) was introduced in 2002.
(2) Full overseas immigration controls operated by UK immigration officers (juxtaposed controls) were opened in France and Belgium in 2002 and 2004.
(3) Fast-track facilities for asylum applications were introduced in 2003.
Falls in asylum applications since 2002 coincide with: the introduction of a process preventing certain nationalities from appealing a decision while in the country in 2002; the opening of UK border controls (often termed ‘juxtaposed’ controls) in France and Belgium in 2002 and 2004 respectively; and the introduction of fast-track facilities for asylum applications in 2003.
8.3 Nationalities applying for asylum
In 2013, the largest number of applications for asylum were from nationals of Pakistan (3,343), followed by Iran (2,417), Sri Lanka (1,808) and Syria (1,669).
The 1,664 increase in applications in 2013 compared with 2012 was driven by rises from a number of nationalities, in particular from Syria (+681), Eritrea (+649), and Albania (+507). While Syria saw the largest increase in applications, it remains fourth for overall numbers of asylum applications.
World events have an effect on which nationals are applying for asylum at any particular time. For example, there have been increases in the number of applicants from Syria since the outbreak of the Syrian civil war in early 2011. Since the early nineties increasing numbers of people have sought asylum from Eritrea in the circumstances of international concern over human rights within the country.
Top 10 nationalities applying for asylum, 2013
(Total number of applications 23,507)
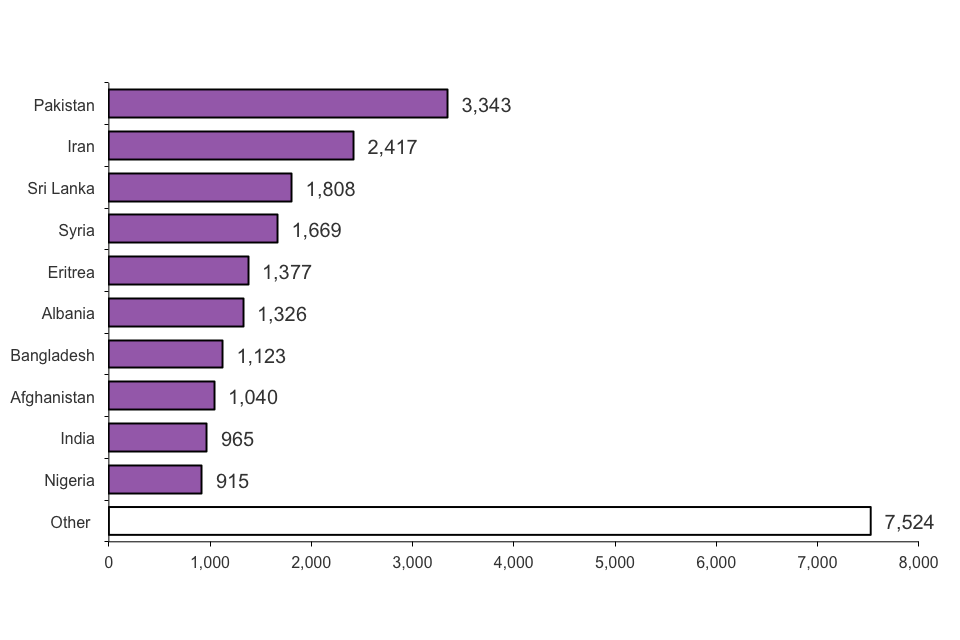
Chart notes
Source: Home Office, Immigration Statistics October to December 2013, Asylum table as 01 q.
8.4 Applications pending
At the end of 2013, 17,180 of the applications received since April 2006 from main applicants were pending a decision (initial decision, appeal or further review), 21% more than at the end of 2012 (14,257).
The increase is accounted for by a rise in the number pending an initial decision (+38%), which coincides with increasing numbers of applications.
8.5 Asylum appeals
The HM Courts and Tribunals Service received 8,512 asylum appeals from main applicants in 2013, a rise of 315 (+4%) compared with 2012 (8,197). This remains well below the peak in the number of appeals for the year 2009 (14,340) using comparable data available from 2007.
In 2013, the proportion of appeals dismissed was 68%, while 25% of appeals were allowed and 7% were withdrawn.
8.6 Unaccompanied asylum-seeking children
There were 1,174 asylum applications from UASCs in 2013, an increase of 4% from 2012 (1,125). These applications represented 5% (1,174) of all main applications for asylum in 2013.
There were 1,013 initial decisions for UASCs in 2013, 49% higher than in 2012 (681). Overall, there was a fall in the proportion of decisions that were grants, from 79% of decisions in 2012 to 69% in 2013.
Due to a change in counting methodology for figures for UASCs, data prior to 2012 are not directly comparable with more recent data.
8.7 Age disputes
The Home Office disputes the age of some asylum applicants who claim to be children.
In 2013, 324 asylum applicants had their age disputed while there were 404 recorded as having completed an age assessment. The number of disputes over the ages of applicants does not necessarily relate to the number of age assessments made in the same period.
Of those who completed age assessments in 2013, 65% had a date of birth showing that they were over 18 when the age dispute was raised. Due to a change in counting methodology for figures for age-disputed cases, data prior to 2012 are not directly comparable with later data.
8.8 Dependants
Including dependants, the number of asylum applications increased from 27,978 to 29,395 in 2013. This is an average of 1 dependant for every 4 main applicants.
In 2013, 4,764 initial decisions were made relating to dependants. Of these 1,730 (36%) were granted asylum, 197 (4%) were granted a form of temporary protection or other type of grant, and 2,837 (60%) were refused.
8.9 Support
The method for processing figures for asylum support changed from the previous publication. Figures from the first quarter of 2013 have been produced using a new method, which allows Home Office Statistics better access to the data for data quality purposes and improved reconciliation with administrative records. The data source for both new and previous methods remains the same. Caution should be taken when comparing earlier data with figures from the first quarter of 2013 onwards, as the figures are not directly comparable.
At the end of December 2013, 23,459 asylum seekers and their dependants were being supported under Section 95. According to previously published figures there were 80,123 asylum seekers in receipt of Section 95 in December 2003 (the start of the published data series).
The number of failed asylum seekers and their dependants receiving support (under Section 4) at the end of December 2013 was 4,831. According to previously published figures, main applicant failed asylum seekers receiving support peaked at the end of September 2009 (12,019).
The overall falls in support applications and numbers receiving support are generally in line with the fall in the number asylum applications since their peak in 2002 (84,132 main applicants) and the clearance of a backlog of asylum cases from the early part of the century.
8.10 Resettlement
In addition to those asylum seekers who apply in the UK, resettlement schemes are offered to those who have been referred to the Home Office by UNHCR (the UN agency for refugees).
In 2013, a total of 967 refugees were resettled in the UK through this process, lower than the previous year (1,039).
8.11 International comparisons
Including dependants, the estimated total number of asylum applications to the EU27 was 411,000 in 2013, an increase of 32% on 2012 when there were 312,400 applications, and the highest since 2002 (from which comparable data are available).
Top 10 EU countries receiving asylum applications, 2013
(Total number of applications 411,000, including dependants)
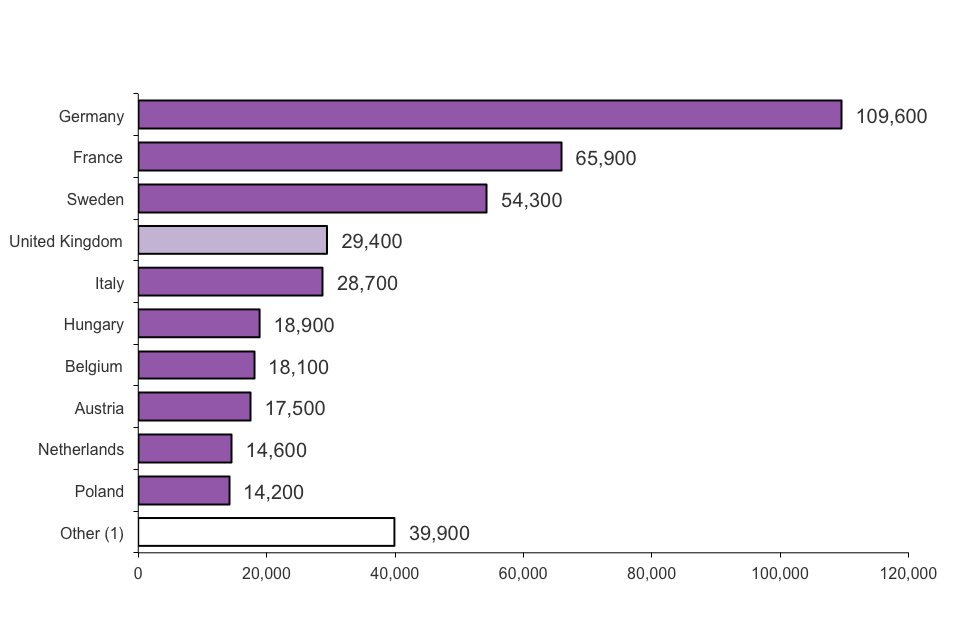
Chart notes
Source: Home Office, Immigration Statistics October to December 2013, Asylum table as 07.
Figures are rounded to the nearest 100.
(1) excludes Croatia which joined the EU on 1st July 2013.
The UK had the fourth highest number of asylum applications within the EU in 2013, which is unchanged from 2012. In both 2013 and 2012, Germany, France and Sweden had more asylum applicants than the UK. In 2013 Hungary was in the top 10 of EU countries receiving asylum applications for the first time.
When the relative size of resident populations of the 27 EU countries is taken into account, the UK ranked 16th in terms of asylum seekers per head of the population in 2013, compared with 13th in 2012.
Quarterly statistics for asylum applications and first instance decisions for the EU Members States are also published by Eurostat (the European statistical organisation). Latest Eurostat figures for the third quarter of 2013 show that the top 3 nationalities of those seeking asylum in the EU27 were Syria, Russia and Serbia.
Eurostat quarterly asylum figures are published in ‘Asylum applicants and first instance decisions on asylum applications’. The user guide also provides a discussion on the differences between the definition of asylum applications used in this release compared to those published by Eurostat.
8.12 Data tables
Data referred to here can be found in the following tables:
9. Extensions of stay
Valid: 27 February to 22 May 2014
9.1 Introduction
The figures in this section relate to the number of people, subject to immigration control, who are granted or refused permission to extend or change the status of their stay in the UK. An individual may make more than one application in any given year.
9.2 Key facts
The total number of grants of extensions increased by 17%, to 306,060 in 2013 compared with 261,810 in 2012. This followed annual falls in each of the previous 3 years from 333,979 in 2009.
Work-related grants of extensions were 13% lower in 2013 (122,451). There was a sharp fall in Tier 1 Post-Study extensions, partly offset by increases in Tier 2 Skilled Workers extensions.
Whilst study-related grants of extensions increased by a third (+29,350), to 116,423, they were still lower than in the previous 3 years.
Family-related grants of extensions more than doubled, rising from 16,627 to 40,670. Nearly two thirds (64%) of this increase was due to grants in the new Family Life (10-year) category.
Of the total decisions in 2013, 23% (92,370) were refused compared with 10% (30,017) of decisions in 2012.This higher refusal rate was accounted for by higher numbers of refusals in the Family and Other categories.
Grants of extensions by reason, and refusals
| Year | Total decisions | Total grants | Work | Study | Family | Other | Refusals and withdrawals |
|---|---|---|---|---|---|---|---|
| 2009 | 393,854 | 333,979 | 163,449 | 129,579 | 23,597 | 17,354 | 59,875 |
| 2010 | 371,868 | 309,475 | 126,943 | 140,151 | 22,048 | 20,333 | 62,393 |
| 2011 | 347,637 | 299,600 | 134,377 | 119,303 | 17,189 | 28,731 | 48,037 |
| 2012 | 291,827 | 261,810 | 140,947 | 87,073 | 16,627 | 17,163 | 30,017 |
| 2013 | 398,430 | 306,060 | 122,451 | 116,423 | 40,670 | 26,516 | 92,370 |
| Change: latest year | +106,603 | +44,250 | -18,496 | +29,350 | +24,043 | +9,353 | +62,353 |
| Percentage change | +37% | +17% | -13% | +34% | +145% | +54% | +208% |
Table notes
Source: Home Office, Immigration Statistics October to December 2013, Extensions table ex 01 q.
9.3 Grants of extensions for work
There were 122,451 work-related grants of extensions in 2013, 13% lower than in 2012 (140,947) and 25% lower than 2009 (163,449).
Grants of extensions to Tier 1 High Value individuals for work fell from 81,843 to 47,358 (-42%) in 2013. This was more than accounted for by a fall in grants in the Post-Study work route which was down from 40,710 to 904. The Post-Study work route was closed to new applications on 6 April 2012 but existing applications continue to be processed after this date. Individuals who have graduated after studying in the UK can stay under other immigration routes if they meet certain criteria.
There were rises in grants in the Tier 1 Entrepreneur route (from 1,302 to 5,083) and in the Tier 1 General route (from 39,122 to 40,297). The Tier 1 General route was closed to applicants who are outside the UK in December 2010 and to migrants who were already in the UK, in most immigration categories, in April 2011, but again, existing applications continued to be processed after this time. Additional analysis in the ‘Extensions of stay by previous category’ article shows that almost all (97%) extensions in the Tier 1 General route in 2012 were granted to individuals already in this route.
There was a 26% increase in grants of extensions for Tier 2 Skilled Workers (from 50,192 to 63,097) in 2013, which is in part likely to relate to policy changes in 2008 following the introduction of the points-based system (PBS). Prior to 2008, skilled workers (Tier 2 equivalents) were able to obtain visas of up to 5 years which could be followed by applications for settlement, without an individual needing to apply for an extension. From the introduction of the PBS in 2008, the maximum visa length for skilled workers was 3 years and individuals who wanted to stay for longer (and to potentially qualify for settlement) needed an extension. Additional analysis of the previous category of individuals granted an extension in the Tier 2 Skilled Workers route in 2011 and 2012 is given in the article ‘Extensions of stay by previous category’.
9.4 Grants of extensions for study
Study-related grants of extensions rose by 34% (+29,350) to 116,423 in 2013. This followed a 38% fall from 140,151 in 2010 to 87,073 in 2012. The study-related grants of extensions include 561 grants under the new Tier 4 Doctorate Extension Scheme,‘Applying from the inside the UK’, introduced on 6 April 2013.
9.5 Grants of extensions for family reasons
Family-related grants of extensions more than doubled (+24,043) to 40,670 in 2013, after falling in each of the previous 3 years. Of the 24,043 increase, 15,487 were due to grants in the new Family Life (10-year) category.
The introduction of the new Family Life (10-year) route, ‘Statement of intent: family migration’, means that the total numbers of family grants are not fully comparable over time and, since 9 July 2012, follows a new approach to people seeking to remain in the UK on the basis of their family and/or private life.
The remainder of the increase in family-related grants of extensions was accounted for by higher numbers of grants to spouses, from 13,895 to 22,384 (+61%), a return to the level seen in 2009 (22,582) but still lower than in 2008 (27,094).
A relatively high share (42%) of the 22,384 grants of extensions to spouses in 2013 was made in the first quarter. This may reflect additional resource deployed to decision-making at the beginning of 2013.
9.6 Grants of extensions for other reasons
Grants of extensions in other categories rose by 54% (+9,353) to 26,516. This mainly reflected an increase in discretionary leave grants. From 9 July 2012, discretionary leave is no longer considered for new applicants seeking to stay in the UK on the basis of their family and/or private life (see the new approach taken to these cases referred to above). However, individuals granted discretionary leave before 9 July 2012 for family or private life reasons may apply to extend that leave when their period of discretionary leave expires.
9.7 Refusals of extensions by category
Work related refusals of extensions more than doubled, rising from 7,311 in 2012 to 14,822 in 2013. There was an increase in Tier 1 refusals of an extension from 4,790 to 11,694 in 2013. This was due to an increase in refusals of extensions to Tier 1 Entrepreneurs (from 655 to 9,632). The increase in refusals of extensions to Tier 1 Entrepreneurs follows the introduction of a credibility test and rule change on funds held. Written ministerial statement: Tier 1 Entrepreneur. These increases were partially offset by a decrease in Tier 1 Post-Study refusals from 3,209 to 287.
Refusals of a family-related extension rose from 2,093 in 2012 to 17,198 in 2013. This was accounted for by an increase in refusals to spouses (from 1,822 to 6,048) and refusals under the new Family Life (10-year) route (11,140 in 2013).
Refusals of study-related extensions rose 11%; from 13,223 to 14,618 in 2013.
There were also increases in the “other” refusals category (up 38,342; from 7,390 to 45,732). Of the 38,342 increase, 6,543 were due to refusals of an extension under the Private Life category and the remainder are likely to mainly relate to refusals of discretionary leave.
Long-term trends in grants and refusals of extensions of stay
The chart below illustrates longer-term trends in grants and refusals to extend stay by calendar year.
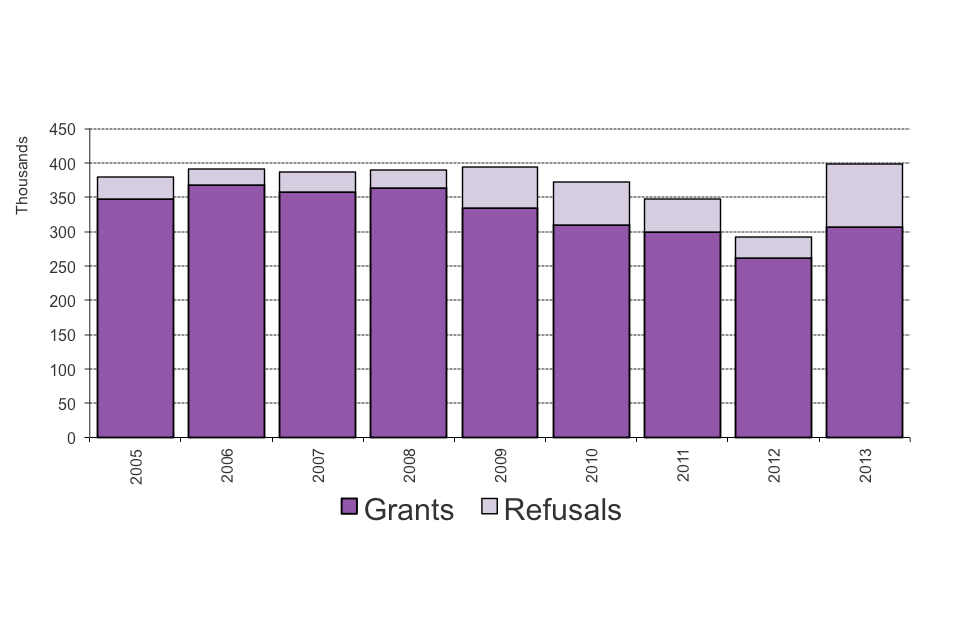
Chart notes
Source: Home Office, Immigration Statistics October to December 2013, Extensions table ex 01.
9.8 Nationalities granted an extension
(excludes dependants)
Data for grants by nationality in 2013 are planned to be published in Immigration Statistics January-March 2014, due to be released in May 2014.
Of the total 197,377 extensions of stay in 2012, 69% (135,334) were granted to Asian nationals and 14% (27,183) were granted to African nationals.
Top 10 nationalities granted an extension to stay, 2012
(Total number of grants 197,377, excludes dependants)
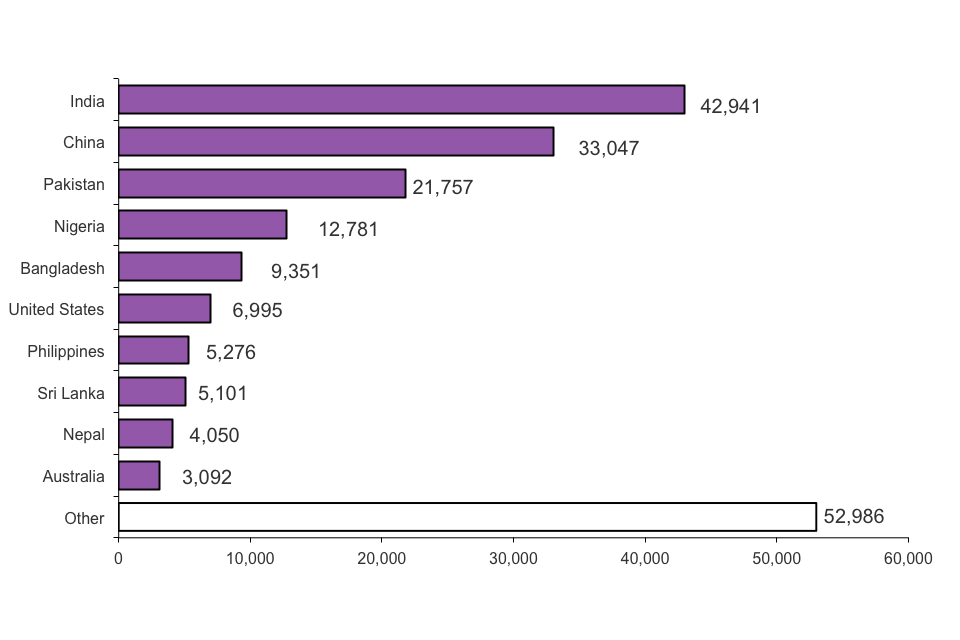
Chart notes
Source: Home Office, Immigration Statistics October to December 2013, Extensions table ex 02.
9.9 Data tables
Further data are available in Extensions tables ex 01 to ex 02.
10. Settlement
Valid: 27 February to 22 May 2014
10.1 Introduction
The figures in this section relate to the number of people, subject to immigration control, who are granted or refused permission to stay permanently in the UK, known as settlement.
10.2 Key facts
The number of people granted permission to stay permanently in 2013 increased by 18% (+23,200) to 152,949, but was still notably lower than in 2010 (241,192). The increase was accounted for by rises in family-related grants (+12,264), asylum-related grants (+9,288), and discretionary or other grants (+4,594), partly offset by a fall in work-related grants (-2,946).
Family-related grants to stay permanently rose by 26% (+12,264), to 59,638, although they were still lower than in 2009 (72,239). The increase was driven by an increase in grants to wives (up 8,871 from 24,779 to 33,650) and husbands (up 3,986 from 12,620 to 16,606).
Work-related grants to stay permanently fell by 5% to 59,249, continuing earlier falls from 84,347 in 2010.
Asylum-related grants to stay permanently rose by 81% to 20,722. The levels in 2009 and 2010 were particularly low, reflecting a rule change in August 2005 that effectively delayed grants for some people. This rule change meant that people given refugee status no longer received a grant immediately, and instead they were given 5 years’ temporary permission to stay.
Grants to stay permanently on a discretionary or other basis rose by 53% (+4,594) to 11,340. This mainly reflected an increase in grants under the Long Residency rules. The high number of grants in earlier years mainly resulted from a review of the backlog of cases from before March 2007 involving unsuccessful asylum applicants.
Grants to permanently stay by reason, and refusals
| Year | Total decisions | Total grants | Work | Asylum-related | Family | Discretionary or Other | Refusals and withdrawals |
|---|---|---|---|---|---|---|---|
| 2009 | 207,341 | 194,781 | 81,185 | 3,110 | 72,239 | 38,247 | 12,560 |
| 2010 | 252,326 | 241,192 | 84,347 | 4,931 | 69,228 | 82,686 | 11,134 |
| 2011 | 174,933 | 166,878 | 69,892 | 13,003 | 54,086 | 29,897 | 8,055 |
| 2012 | 133,850 | 129,749 | 62,195 | 11,434 | 47,374 | 8,746 | 4,101 |
| 2013 | 160,386 | 152,949 | 59,249 | 20,722 | 59,638 | 13,340 | 7,437 |
| Change: latest year | +26,536 | +23,200 | -2,946 | +9,288 | +12,264 | +4,594 | +3,336 |
| Percentage change | +20% | +18% | -5% | +81% | +26% | +53% | +81% |
Table note
Source: Home Office, Immigration Statistics October to December 2013, Settlement table se 02 q.
Long-term trends in grants to stay permanently
The chart below illustrates longer-term trends in grants to stay permanently for the calendar years back to 2003.
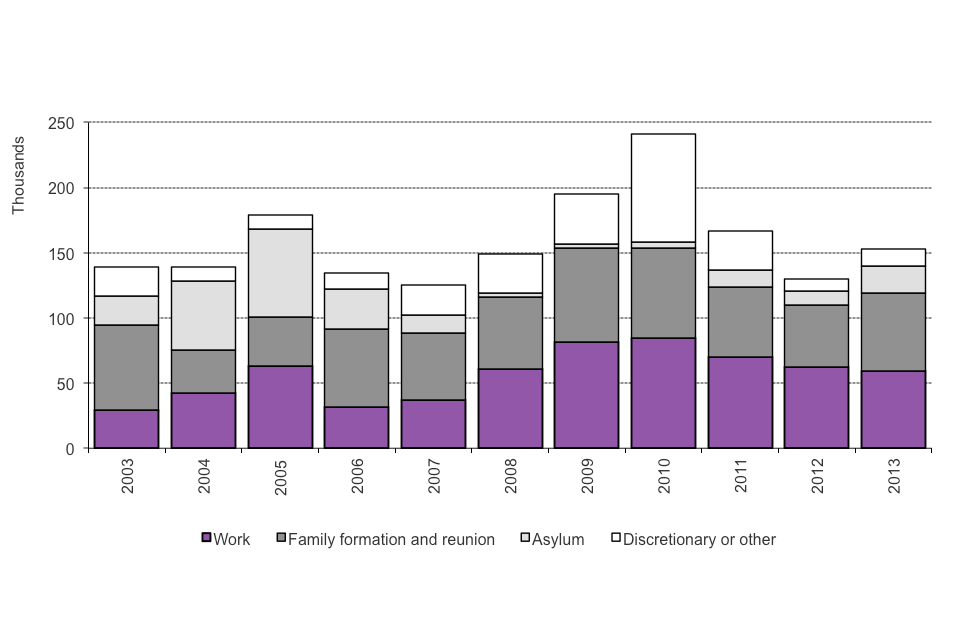
Chart notes
Source: Home Office, Immigration Statistics October to December 2013, Settlement table se 02.
The increase in total numbers of people granted permission to stay permanently from 2001 to 2005 was mainly due to increases in work and asylum-related grants, which then fell in 2006 and 2007. This reflects changes to rules on how quickly those with refugee status or humanitarian protection were granted settlement and how quickly individuals qualified for work-related settlement. The higher total levels in 2009 and 2010 were due to grants given on a discretionary or other basis resulting from a review of the backlog of cases involving unsuccessful asylum applicants, and the falls in 2011 and 2012 follow the completion of the review.
10.3 Nationalities granted permission to stay permanently
Of the total 129,749 grants of permission to stay permanently in 2012, around half (54% or 70,612) were to Asian nationals and nearly a quarter (24% or 30,826) were to African nationals.
Data for grants by nationality in 2013 are planned to be published in Immigration Statistics April-June 2014, due to be released in August 2014.
Top 10 nationalities granted permission to stay permanently, 2012
(Total 129,749)
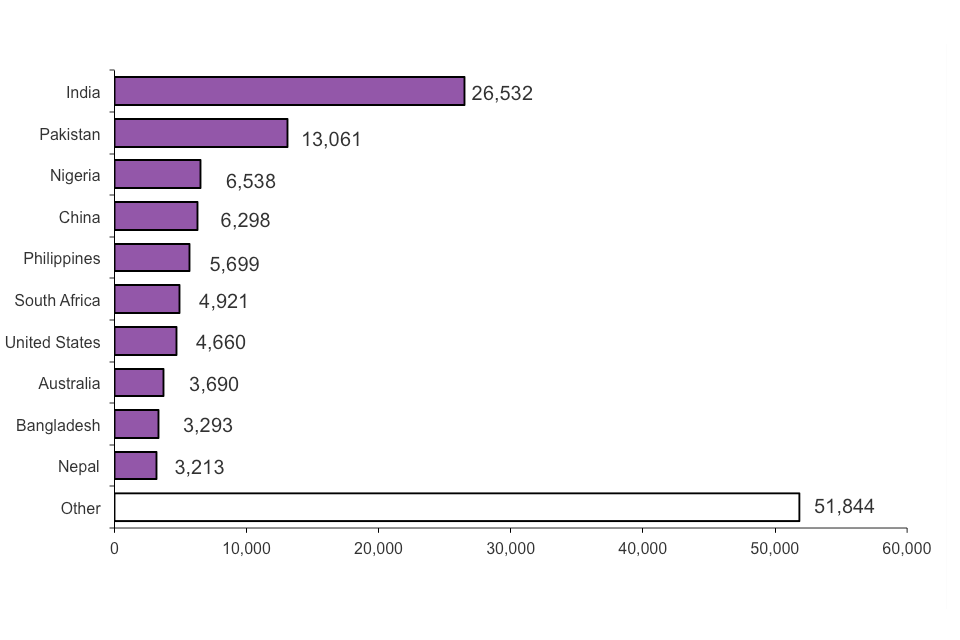
Chart notes
Source: Home Office, Immigration Statistics October–December 2013, Settlement table se 03.
10.4 Data tables
Further data are available in Settlement tables se 01 to se 06.
11. Citizenship
Valid: 27 February to 22 May 2014
11.1 Introduction
The figures in this section relate to the number of people who are granted or refused British citizenship.
11.2 Key facts
In 2013, there were 215,662 decisions about British citizenship 7% more than in 2012. Correspondingly there were 7% more people granted British citizenship (up by 13,850 to 208,059). The overall increase in the last decade is likely, in part, to reflect increased grants of permission to stay permanently (known as settlement).
Applications rose by 27% to 230,033 in 2013, the highest since 2002, the first year for which comparable figures are available. This increase included a surge in applications received ahead of changes to the Life in the UK test English language requirement that came into force on 28th October 2013.
The 13,850 increase in grants of British citizenship was accounted for by higher numbers of people granted on the basis of residence, (up 6,309 to 113,411), marriage (up 7,180 to 46,302) and to children (up 1,301 to 44,265). Grants for other reasons fell (by 940 to 4,081).
Grants and refusals of citizenship
| Total decisions | Total grants | On basis of residence | On basis of marriage | On basis of children | Other bases | Refusals & withdrawals | |
|---|---|---|---|---|---|---|---|
| 2009 | 214,040 | 203,789 | 99,474 | 52,627 | 47,814 | 3,874 | 10,251 |
| 2010 | 203,020 | 195,046 | 93,681 | 47,028 | 48,611 | 5,726 | 7,974 |
| 2011 | 184,669 | 177,785 | 94,660 | 35,616 | 41,993 | 5,516 | 6,884 |
| 2012 | 201,087 | 194,209 | 107,102 | 39,122 | 42,964 | 5,021 | 6,878 |
| 2013 | 215,662 | 208,059 | 113,411 | 46,302 | 44,265 | 4,081 | 7,603 |
| Change: latest year | +14,575 | +13,850 | +6,309 | +7,180 | +1,301 | -940 | +725 |
| Percentage change | +7% | +7% | +6% | +18% | +3% | -19% | +11% |
Table notes
Source: Home Office, Immigration Statistics October to December 2013, Citizenship tables cz 01 q and cz 02 q.
Long-term trends in grants of citizenship
The chart below illustrates longer-term trends in grants of citizenship by calendar year.
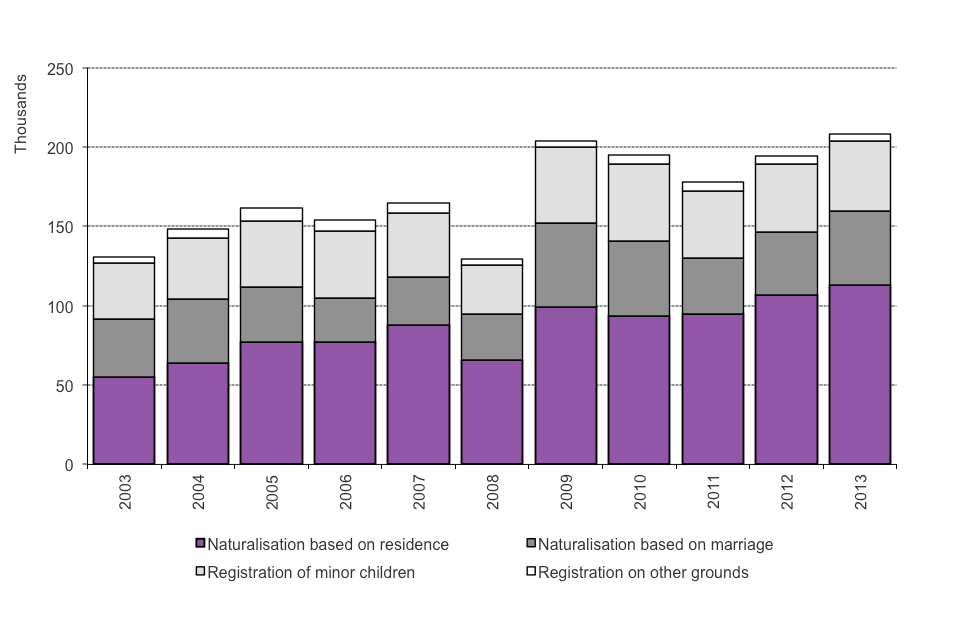
Chart notes
Source: Home Office, Immigration Statistics October to December 2013, Citizenship table cz 03 q.
There has been a general increase in the last decade, with some fluctuation, that is likely, in part, to reflect increased grants of permission to stay permanently (known as settlement) up until 2010. After a period of residence those granted settlement become eligible to apply for citizenship.
Grants of citizenship in 2008 were reduced when staff resources were temporarily transferred from decision-making to deal with the administration of new applications. There were 208,059 grants in 2013, more than double the level seen in 2001 (90,282) and the highest comparable annual total since records began in 1962.
Applications have also shown a rising trend since 2001 with notable surges in 2005 (211,911) and 2013 (230,033). The increase in applications made in 2005 may have reflected people anticipating the introduction of Knowledge of Life in the UK tests on 1st November that year. Similarly the increase in 2013 may, in part, have been due to people anticipating the rule change to the English language element of the Life in the UK test as of 28th October 2013. See the Policy and Legislative Changes Timeline.
11.3 Grants of citizenship by previous nationality
Data for grants by nationality in 2013 are planned to be published in Immigration Statistics January-March 2014, due to be released in May 2014.
Former Indian and Pakistani nationals have accounted for the largest numbers of grants in almost every year from 2001 to 2012, with the exception of 2007, when former nationals of Pakistan accounted for only the fifth highest number. Together, former Indian and Pakistani nationals accounted for almost a quarter (24%) of grants in 2012.
Top 10 previous nationalities granted citizenship, 2012
(Total number of grants 194,209)
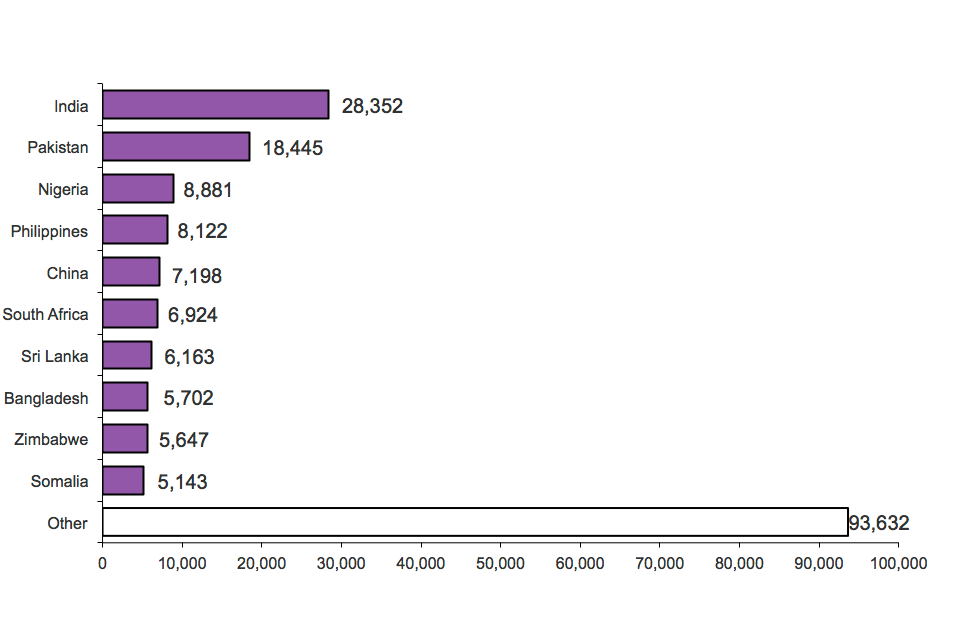
Chart notes
Source: Home Office, Immigration Statistics October to December 2013, Citizenship table cz 06.
The top 7 previous nationalities remained the same in 2012 as in 2011, Bangladeshi nationals were eighth (previously tenth), and Zimbabwe and Somali nationals were ninth and tenth (replacing Iraq and Iran in the top 10).
11.4 Where are new citizens attending ceremonies?
While the total number of ceremonies attended has changed in line with grants, the geographical distribution has remained similar since 2009. The proportion of ceremonies in the London region was 54% in 2005 but fell to 42% by 2009, with increases over the same period in the proportions for the North West, Yorkshire and the Humber, the West Midlands and the South East. However, in 2012 London remained the region with the highest proportion of ceremonies (42%).
11.5 Data tables
Further data are available in on British Citizenship Tables cz 01 to cz 10.
In addition to applications and detailed breakdowns of decisions, these include information on citizenship ceremonies attended and renunciations of citizenship.
12. Detention
Valid: 27 February 2014 to 22 May 2014
12.1 Introduction
The figures in this topic brief relate to the number of people entering, leaving or in detention, solely under Immigration Act powers, at immigration removal centres (IRCs), short-term holding facilities (STHFs) and pre-departure accommodation (PDA).
12.2 Key facts
The number of people entering detention increased to 30,423 in 2013, up 5% on the previous year (28,905) and the highest figure using comparable data available since 2009. Over the same period there was an increase of 5% in those leaving detention (from 28,575 to 30,036). The higher throughput may relate to more rigorous attention to detainee reviews which are conducted at regular intervals by an immigration official.
There was a decline in the number of detainees being removed from 60% in 2012 to 56% in 2013, and an increase in the number of detainees granted temporary admission or release from 31% to 36% in the same period.
As at the end of December 2013, 2,796 people were in detention, 4% higher than the number recorded at the end of December 2012 (2,685).
In the fourth quarter of 2013, 63 children entered detention in immigration removal centres, short-term holding facilities and pre-departure accommodation. The number of children entering detention has fluctuated in recent quarters, following a period of consecutive increases from a low point of 19 at the start of 2011 up to 66 for the second quarter of 2012. Cedars PDA was opened during the third quarter of 2011 and has been specifically designed for families, providing, among other facilities, internal and external play areas for children. Subject to a risk assessment and suitable supervision arrangements, some family members may be allowed to undertake recreational activities outside the accommodation location. However, as with those held elsewhere, those entering PDA are detained under Immigration Act powers. Numbers of children entering detention remain well below a previous peak of 322 for the third quarter of 2009.
People entering, leaving and in detention, solely under Immigration Act powers
| Year | Entering detention | Leaving detention | In detention |
|---|---|---|---|
| 2010 | 25,904 | 25,959 | 2,525 |
| 2011 | 27,089 | 27,181 | 2,419 |
| 2012 | 28,905 | 28,575 | 2,685 |
| 2013 | 30,423 | 30,036 | 2,796 |
| Change: latest year | +1,518 | +1,461 | +111 |
| Percentage change | +5% | +5% | +4% |
Table notes
Source: Home Office, Immigration Statistics October to December 2013, Detention tables dt 01, dt 05 and dt 11 q.
12.3 Length of detention
During 2013, 30,036 people left detention. Of these, 18,544 (62%) had been in detention for less than 29 days, 5,628 (19%) for between 29 days and two months and 3,988 (13%) for between two and four months. Of the 1,876 (6%) remaining, 199 had been in detention for between one and two years and 50 for two years or longer.
Around a third of people leaving detention were detained for seven days or less (10,610). Of these, 6,775 (64%) were removed, 3,560 (34%) were granted temporary admission or release and 82 (1%) were bailed. Of the 249 detained for 12 months or more, 92 (37%) were bailed, 89 (36%) were removed and 60 (24%) were granted temporary admission or release.
12.4 Children in detention
In the fourth quarter of 2013, 63 children entered detention, compared with 65 in the fourth quarter of 2012 and 45 in the fourth quarter of 2011. Of those children entering detention in the fourth quarter of 2013, 30 were initially detained at Cedars PDA, 29 at Tinsley House (Family Unit) IRC, one at Campsfield House IRC, one at Morton Hall IRC, one at Tinsley House (Non Family Unit) IRC and one at Larne House STHF.
Of the 67 children leaving detention in the fourth quarter of 2013, 25 were removed from the UK, 40 were granted temporary admission or release and two were granted Leave to Enter/Remain. Of those leaving detention, 49 had been detained for less than three days, 15 for between four and seven days, one had been detained for between eight and fourteen days and two for between 29 days and 2 months. The number of children removed from the UK on leaving detention has ranged from 2 out of 24 in the first quarter of 2011 to 24 out of 38 in the first quarter of 2013.
Children entering detention, solely under Immigration Act powers
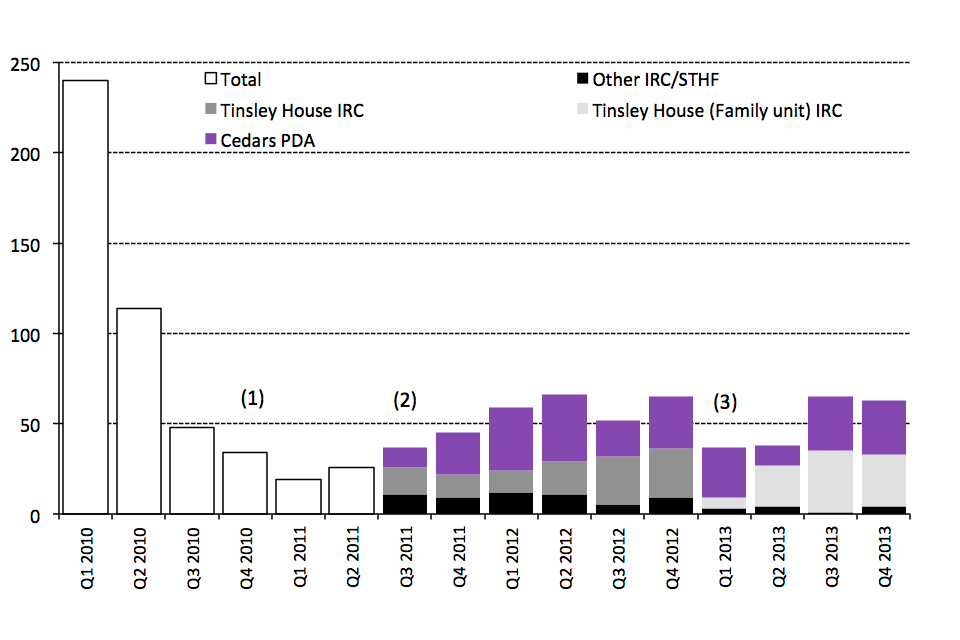
Chart notes
Source: Home Office, Immigration Statistics October to December 2013, Detention table dt 02 q.
(1) Oakington Reception Centre closed on 12 November 2010, Yarl’s Wood closed to families with children on 16 December 2010.
(2) Cedars PDA opened on 17 August 2011. From the third quarter of 2011, all child detainees in Tinsley House are shown in Tinsley House IRC. From January 2013 child detainees in Tinsley House IRC, as part of a family, are shown in Tinsley House (Family Unit) IRC; the remainder are shown in Other IRC/STHF.
(3) Tinsley House IRC closed to new entrants from 18 January to 20 March 2013 due to an infectious illness.
12.5 New table on the cumulative length of detention of people leaving detention
Following a consultation with users of migration statistics, a new table has been introduced in Immigration Statistics, October to December 2013, to provide further information on the cumulative length of detention of people leaving detention by year (i.e. the total length of time someone is detained for, including multiple periods of detention). Table dt 10 shows that there were 1,183 people leaving detention in 2012 whose cumulative period of detention since 2010, including multiple periods of detention, had been for between 3 and 4 months. Further information is available from the “Notes” page in the detention tables.
12.6 Data tables
Further data are available in Detention tables dt 01 to dt 14 q.
13. Removals and voluntary departures
Valid: 27 February 2014 to 22 May 2014
13.1 Introduction
The figures in this section relate to numbers of people, including dependants, leaving the UK either voluntarily when they no longer had a right to stay in the UK or where the Home Office has sought to remove them. While individuals removed at a port of entry have not necessarily entered the country, their removal requires action by the UK Border Force and Home Office, such as being placed on a return flight, and are therefore detailed below. The numbers of people leaving the UK by the various types of departure (enforced removals; refused entry at port and subsequent departures; and voluntary departures) are given below.
13.2 Key facts
Enforced removals from the UK decreased by 11% to 13,051 in 2013 compared with 2012 (14,647). This represents the lowest figure since the series began in 2004.
The number of passengers refused entry at port and who subsequently departed has increased by 2% in 2013 to 14,124 from 13,789 for the previous year. Long-term trends show levels decreasing since 2004.
In 2013, there was an increase of 10% in total voluntary departures to 32,661 compared with the previous year (29,663). This category has represented the largest proportion of those departing from the UK since the end of 2009. The retrospective nature of data-matching exercises that are undertaken to count for some voluntary departures means that the figures for the latest periods are particularly subject to upward revision (see the section ‘About the figures’).
Removals and voluntary departures by type
| Year | Total enforced removals | Total refused entry at port and subsequently departed | Total voluntary departures (1) | Assisted Voluntary Returns (2) | Notified voluntary departures (3) | Other confirmed voluntary departures (1)(4) | Other confirmed voluntary departures as a % of voluntary departures |
|---|---|---|---|---|---|---|---|
| 2009 | 15,252 | 29,162 | 22,800 | 4,944 | 4,317 | 13,539 | 59% |
| 2010 | 14,854 | 18,276 | 27,114 | 4,541 | 5,996 | 16,577 | 61% |
| 2011 | 15,063 | 15,700 | 26,419 | 3,120 | 7,587 | 15,712 | 59% |
| 2012 | 14,647 | 13,789 | 29,663 | 3,706 | 6,749 | 19,208 | 65% |
| 2013 | 13,051 | 14,124 | 32,661 | 4,284 | 8,147 | 20,230 | 62% |
| Change: latest year | -1,596 | +335 | +2,998 | +578 | +1,398 | +1,022 | - |
| Percentage change | -11% | +2% | +10% | +16% | +21% | +5% | - |
Table notes
Source: Home Office, Immigration Statistics October to December 2013, Removals table rv 01 q.
(1) The figures for total voluntary departures and confirmed voluntary departures will initially be undercounts due to data-matching exercises that take place after the statistics are produced.
(2) Assisted Voluntary Return – where financial assistance is provided.
(3) Notified Voluntary Departure – where a person notifies the Home Office that they have departed.
(4) Other confirmed voluntary departure – where a person has been identified as leaving when they no longer had the right to remain in the UK, either as a result of embarkation controls or by subsequent data matching on Home Office systems.
Of the total voluntary departures in the year 2013, 62% of those departing were categorised as other confirmed voluntary departures, 25% as notified voluntary departures and 13% as Assisted Voluntary Returns (AVRs). The largest category, other confirmed voluntary departures, are cases where a person has been identified as leaving when they no longer had the right to remain in the UK, either as a result of embarkation controls or by subsequent data matching on Home Office systems. This category has been the largest within total voluntary departures since 2007 when it surpassed AVRs. AVRs fell from 6,200 to 4,157 in 2007 whereas other confirmed voluntary departures increased from 4,449 to 6,883 in the same period and have increased almost every year since, to 20,230 in 2013.
Long-term trends in removals and voluntary departures by type, by quarter
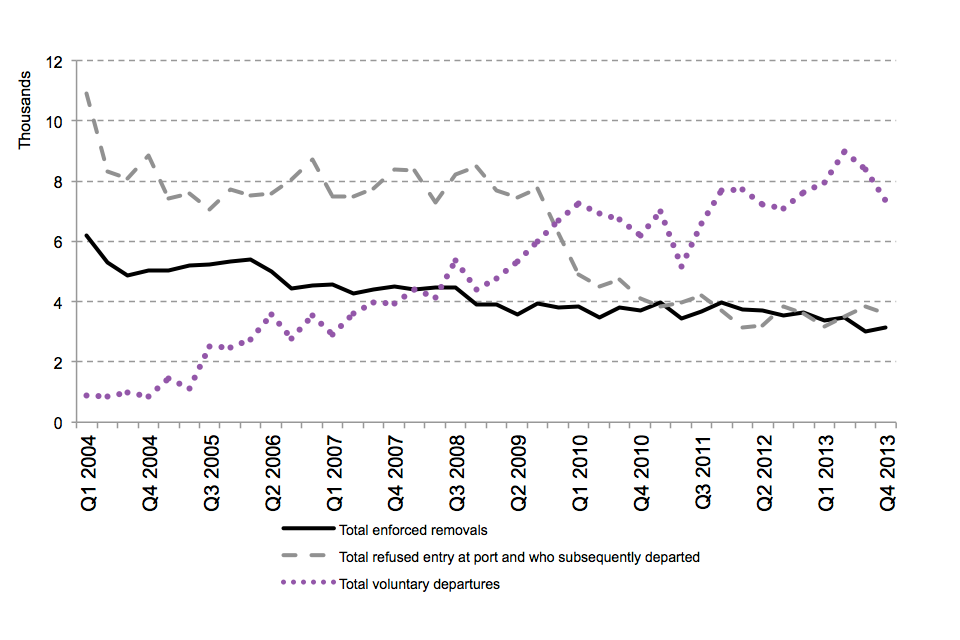
Chart notes
Source: Home Office, Immigration Statistics October to December 2013, Removals table rv 01 q.
The number of people refused entry at port and subsequently departed has decreased since the beginning of the data series in 2004. The 42% decrease from the third quarter of 2009 (7,751) to the second quarter of 2010 (4,520) has no identified single cause, although 26% of the decrease was due to a fall in the number of nationals of Afghanistan being refused entry and subsequently removed (-855). The overall falls are likely to be due to a combination of factors, including tighter screening of passengers prior to travel and changes in visa processes and regimes, for example, South African nationals have been required to have a visa for any length or type of visit to the UK since July 2009.
The long-term trend in voluntary departures increased steadily to the first quarter of 2010, but quarterly figures since 2010 have shown signs of a more gradual upward trend despite some fluctuations. The long-term increase coincides with the Home Office improving its contact management with migrants and its ability to track those that are leaving the UK. The figures include individuals who have been identified by administrative exercises as those who have overstayed their leave, and then subsequently left the UK without informing the Home Office. This identification process allows the Home Office to focus its enforcement action on those who remain in the UK. As mentioned above, the figures for the most recent quarters will be subject to upward revision as matching checks are made on travellers after departure.
The number of enforced removals has steadily declined over time, although this has been more gradual in recent years. The latest annual figure (2013; 13,051) represents the lowest level since the series began in 2004.
13.3 Asylum and non-asylum enforced removals
In 2013 there were 4,671 enforced removals of people who had sought asylum at some stage, down 8% from the previous year (5,068). This figure is 60% lower than the peak in 2004 (11,743) when this data series began. This long-term decrease in the enforced removal of those seeking asylum can be viewed in the context of a generally decreasing trend in asylum applications since 2002; although the asylum applications have increased in recent years, they still remain low compared to the peak in 2002.
In 2013, 64% of total enforced removals were non-asylum cases (8,380), down 13% from the previous year (9,579) and down 17% from the peak of 10,070 in 2008.
13.4 Removals and voluntary departures by nationality
The highest number of enforced removals in 2013 were for nationals of Pakistan (1,911; 15% of the total). The second highest were for nationals of India (1,406; 11% of the total), who have also shown the largest decrease compared with the previous year (-753 or -35%).
The highest number of passengers refused entry at port and subsequently departed involved nationals of the United States (2,030; 14% of the total) who have also shown the largest increase compared with the previous year (+211 or +12%). The second and third highest involved nationals of Albania (922) and Brazil (885). Nationals of the United States and Brazil who are not coming to the UK for work or for six months or more do not need to apply for, and be issued with, a visa prior to arrival. The first time that they can be refused entry will therefore be on arrival to the UK.
The highest number of voluntary departures in 2013 involved nationals of India (7,512; 23% of the total). The second highest involved nationals of Pakistan, with 3,929 voluntary departures, who have also shown the largest increase compared with the previous year (+534 or +16%).
13.5 Departures by ‘harm’ assessment
The harm matrix was introduced in 2007 for monitoring the Public Service Agreement that then was applied to measure performance in removing the most harmful people first. ‘Higher harm’ assessments include people who have committed serious criminal and immigration offences.
In the year ending March 2013, 14,283 enforced removals and 29,883 voluntary departures were subject to an assessment for a harm rating, of which 18% and 1% respectively were assessed as ‘higher harm’. In the previous financial year, 22% of enforced removals and 1% of total voluntary departures were assessed as ‘higher harm’.
13.6 Foreign national offenders
The Home Office removes foreign national offenders either by using enforcement powers or via deportation. Numbers of foreign national offenders removed from the UK are included within the total number of enforced removals. In 2013, 4,667 foreign national offenders were removed, down 2% from the previous year (4,765).
13.7 Data tables
Further data on removals and voluntary departures are available in:
14. European Economic Area (EEA)
Valid: 27 February to 22 May 2014
14.1 Introduction
The European Economic Area (EEA) consists of countries within the European Union, together with Norway, Iceland and Liechtenstein. Nationals of the EEA and Switzerland have rights of free movement within the UK and are generally not subject to immigration control (though nationals of Bulgaria and Romania had employment restrictions placed on them until 31 December 2013; transitional restrictions on the employment of nationals of Croatia remain in place). Hence there is less information available about EEA nationals from the Home Office’s immigration control administrative systems. This section brings together the information that is available relating to EEA nationals. This will be the last substantive update to data relating to employment of EU2 (Bulgarian and Romanian) nationals under transitional arrangements, following the lifting of restrictions on 1st January 2014.
14.2 Key facts
In 2013 a large proportion (88%) of the 111.1 million journeys to the UK were by British, other EEA or Swiss nationals who have rights of free movement and are not subject to immigration control.
In the year ending September 2013, more British nationals emigrated from the UK (138,000) than immigrated to the UK (79,000) i.e. a net migration of -60,000. By contrast, fewer other EU nationals emigrated from the UK (78,000) than immigrated to the UK (209,000), i.e. net migration of +131,000.
In the first 6 months since the accession of Croatia on 1 July 2013, 267 applications were received from Croatians for either authorisation to work or for a registration certificate confirming that the applicant is exercising a right to reside in the UK.
For EU2 nationals (Bulgaria and Romania), there were 1,905 applications for accession worker cards in 2013 and 17,177 applications for registration certificates, down 22% and 39% respectively compared with 2012. There were corresponding falls in approvals to 1,526 (-15%) and 12,930 (-42%). Applications for accession worker cards and registration certificates have followed a downward trend since 2011.
For EU2 nationals, approvals under the Sector Based Scheme (SBS) continued to fall, by 31% to 335 in 2013. Issuance of work cards under the Seasonal Agricultural Workers Scheme (SAWS) fell by 6% to 19,630.
The SAWS and SBS closed at the end of 2013, when restrictions on Bulgarian and Romanian nationals ended. These arrangements have not been open to Croatian nationals.
Bulgarian and Romanian nationals were also able to work in the UK on a self-employed basis, without being required to apply for documentation to confirm this right. From accession on 1 July 2013 this has also been the case for Croatian nationals. Separate figures from the ONS Labour Force Survey indicate an increase between 2009 and 2013 in the estimated numbers of Bulgarians (from 22,000 to 42,000) and of Romanians (from 35,000 to 85,000) living in households and working in the UK. These estimates are based on sample data and as with any survey estimates they are subject to a great deal of sampling variability. The EU2 estimates, being based on small numbers of respondents, are more variable than those for larger nationality groupings.
In 2013, there were 102,006 decisions on applications for residence documents (for EEA nationals and non-EEA nationals who were related to EEA nationals), up 22%. Of these decisions there were 20% more providing an initial recognition of right to reside (38,736 up 6,521) and 48% more giving recognition of permanent residence (22,463 up 7,266).
14.3 Admissions of EEA nationals
Passenger arrivals including estimates of EEA admissions
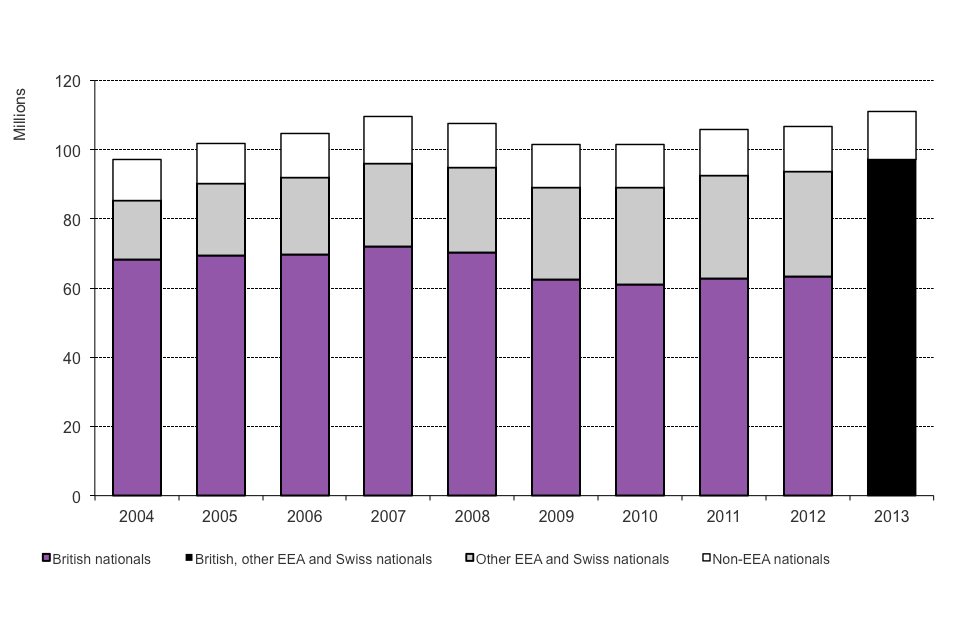
Chart notes
Data showing British nationals and other EEA and Swiss nationals separately for 2013 will be available in May 2014.
Source: Home Office, Immigration Statistics October–December 2013, Admissions table ad 01.
Estimates from the IPS provide EU nationals’ reasons for entry to the UK. The large majority are either visitors for less than 12 months or individuals returning to the UK (Source: ONS, Travel Trends 2012).
The number of British passenger arrivals rose from 68.2 million in 2004 to 71.9 million in 2007 and then fell to 60.9 million in 2010. It has since risen again to 64.7 million in the 12 months to December 2013, the latest period for which an estimate is available.
Between 2001 and 2003, the number of Other EEA and Swiss passenger arrivals was relatively stable, being between 14 and 15 million; however, there was an increase in 2004 to 17 million, which coincided with 10 countries joining the EU/EEA.
The number of Other EEA and Swiss passenger arrivals rose to 30.6 million in 2012 and to 31.8 million in the 12 months to September 2013 (the latest period for which an estimate is available). From 2007, arrivals will have been boosted by nationals of Bulgaria and Romania, following these countries becoming part of the EEA.
14.4 Migration of EU nationals
Provisional Long-Term International Migration estimates define immigrants as individuals who are resident for at least a year in the UK (or abroad for emigrants). In the year ending September 2013, Long-Term International Migration estimates of those migrating for at least 12 months indicate that fewer British nationals immigrated to the UK than emigrated from the UK; 79,000 nationals immigrating and 138,000 emigrating, i.e. a net migration of -60,000, compared to -72,000 in the previous 12-month period. This compares with an estimated 209,000 other EU nationals immigrating and 78,000 emigrating in the year ending September 2013, i.e. a net migration of +131,000, a statistically significant increase from the previous 12 months (+65,000).
Estimates from the International Passenger Survey show that in the year ending September 2013, 48% of British and 66% of other EU national immigrants came for work-related reasons. By contrast, only 20% of non-EU immigrants came for work, while 57% came for study.
Source: ONS, Provisional Long-Term International Migration (LTIM) estimates.
The Office for National Statistics has published on its web site a short report about the latest available statistics on Bulgarian and Romanian migration to the UK, which includes a guide to the availability of data for 2014.
14.5 Croatia
In the first 6 months since accession on 1 July 2013, 267 applications were received from Croatians either for authorisation to work (i.e. for an accession worker registration certificate) or for a registration certificate confirming that the applicant is exercising a right to reside on a basis other than authorised employment. Of these 97 were for accession worker registration certificates and 170 were for other registration certificates. As at 21 January 2014, 75 of the accession worker registration certificate applications and 142 other registration certificates had been approved.
14.6 ‘EU2’ countries – Bulgaria and Romania
Applications for accession worker cards, required until 31 December 2013 by Bulgarians and Romanians to work in the UK as an employee, and for registration certificates that provide proof of residency rights, fell in 2013, with falls of 22% to 1,905 and 39% to 17,177, respectively. The corresponding data on approvals show falls of 15% to 1,526 and 42% to 12,930. Applications for accession worker cards and registration certificates have followed a downward trend since 2011.
Approvals data for the second and third quarters of 2013 have been revised upward compared to data previously published following the allocation of additional resource to deal with these cases within the Home Office. As at 21st January 2014 all EU2 applications had been recorded and only a small number remained to be decided.
Revised EEA tables ee 01 and ee 01 q show a complete breakdown of decisions by type in applications for EU2 accession worker cards and registration certificates between 2007 and 2013 along with cases outstanding as at 21st January 2014.
Approvals under the SBS fell from a peak of 1,569 in 2008, to 335 in 2013. The Migration Advisory Committee’s ‘Migrant Seasonal Workers’ report suggests that the fall in SBS approvals may partly reflect a reduction in employee turnover along with falls in the number of employers participating in the scheme (see Other related data).
SAWS approvals rose from 8,058 in 2007 to 16,461 in 2008 and averaged around 20,000 from 2009 to 2011. There was a slight rise to 20,821 in 2012 but they fell back in 2013 to 19,630. SAWS quotas for 2007 and 2008 were 16,250 and from 2009 to 2013 were 21,250. Approvals may not match the quota figure due to lags in recording and the inclusion of replacement cards.
Bulgarian and Romanian nationals were also able to work in the UK on a self-employed basis, without being required to apply for documentation to confirm this right. Separate figures from the ONS Labour Force Survey (including both employed and self-employed) indicate an increase between 2009 and 2013 in the numbers of Bulgarians (from 22,000 to 42,000) and Romanians (from 35,000 to 85,000) living and working in the UK. (Source: Table 4.3, International Migration and the United Kingdom, Report of the United Kingdom SOPEMI correspondent to the OECD, 2013.
14.7 Residence document decisions
Under European law, EEA nationals do not need to obtain documentation confirming their right of residence in the UK. However, if they want to support an application for a residence card by any of their family members who are not EEA nationals, they must demonstrate that they are residing in the UK in accordance with the Immigration (European Economic Area) Regulations 2006 and are “exercising Treaty rights” in the UK. The Home Office website provides details of documentation for EEA nationals, ‘Residence documents for European nationals’.
There were 102,006 decisions on applications for EEA residence documents in 2013, 22% (18,362) more than in 2012.
Decisions recognising permanent residence have shown a generally rising trend between 2007 (7,623) and 2013 (22,463). This may reflect the numbers previously issued initial right to reside documents and living in the UK under European regulations for 5 years becoming eligible to apply for documents certifying permanent residence. Since 2010 Poland has been the top nationality issued documents recognising permanent residence (4,212 in 2013), with Romanian and Bulgarian nationals rising to 2nd and 3rd in 2012 and 2013 (2,824 to Romanians and 2,402 to Bulgarians in 2013).
Decisions to issue initial right to reside documents rose in 2013 (by 20% to 38,736), but have shown a generally falling trend since 2007. Polish nationals were issued the most initial right to reside documents in each year between 2006 and 2011, but in 2012 and 2013 nationals of Portugal received the highest number (3,289 and 4,196 respectively).
The number of applications found to be invalid on receipt by the Home Office in 2013 compared to 2012 fell to 4,099 for initial right to reside (from 14,438) and to 2,390 for documents certifying permanent residence (from 9,568). This category of decision was introduced in 2011 for applications that didn’t provide key information or documentation but, due to changes in late 2012 to the administration of EEA residence document applications, was recorded less in 2013. Applications are either issued or refused instead. Applications refused or found to be invalid may result in an immediate re-application, resulting in a further decision being counted in Table ee 02. The majority of applications recorded as invalid on receipt in 2013 were because the applicant had not included the fee required after 1 July 2013.
14.8 Data tables
Further data on EEA nationals are available in the following tables:
15. About this Release
The Immigration Statistics quarterly release gives an overview of work on immigration within the Home Office, including the work of UK Border Force and UK Visas and Immigration. It helps inform users including the Government, Parliament, the media and the wider public, and supports the development and monitoring of policy.
The release includes the following topic briefings: (cross-cutting) Work, Study, Family, (single topic) Before Entry, Admissions, Extensions, Settlement, Citizenship, Asylum, Removals and Voluntary Departures, Detention and the European Economic Area. Detailed tables of figures accompany each of the topic briefings, providing data up to the fourth quarter of 2013 (October to December).
The ‘Immigration Statistics’ release is a National Statistics output produced to the highest professional standards and free from political interference. It has been produced by statisticians working in the Home Office Statistics Unit in accordance with the Home Office’s ‘Statement of compliance with the Code of Practice for Official Statistics’ which covers our policy on revisions and other matters. The governance arrangements in the Home Office for statistics were strengthened on 1 April 2008 to place the statistical teams under the direct line management of a Chief Statistician, who reports to the National Statistician with respect to all professional statistical matters.
15.1 National Statistics
The UK Statistics Authority has designated these statistics as National Statistics, in accordance with the Statistics and Registration Service Act 2007 and signifying compliance with the Code of Practice for Official Statistics. Designation can be broadly interpreted to mean that the statistics:
- meet identified user needs
- are well explained and readily accessible
- are produced according to sound methods
- are managed impartially and objectively in the public interest
Once statistics have been designated as National Statistics it is a statutory requirement that the Code of Practice shall continue to be observed.
The assessment report (No. 177) and letter of confirmation as National Statistics can be viewed on the UK Statistics Authority (Assessment reports) website.
15.2 Changes to topic briefings and tables
There have been a range of improvements to the following topic briefings and tables in this release:
- Cumulative length of detention: Following a consultation with users of migration statistics, a new table (dt 10) has been introduced to provide information on the cumulative length of detention of people leaving detention by year (i.e. the total length of time someone is detained for, including multiple periods of detention).
- Tables ee 01 and ee 01 q in the EEA section have been expanded to show a more complete breakdown of decisions by type in applications for EU2 accession worker cards and registration certificates between 2007 and 2013 along with cases outstanding as at 21st January 2014.
The Migrant Journey 4 analysis was also published on 19 February. This contains results from a 5 year follow-up for those given visas in 2007 and a backward looking analysis for those granted settlement in 2012. The plan going forward is for this analysis to become a regular annual official statistics release.
15.3 Revisions to data
Within the Removals and Voluntary Departures section there have been revisions relating to the category ‘other confirmed voluntary departures’. Retrospective checks mean that figures for voluntary departures are subject to upward revision. This is particularly so for confirmed voluntary departures that are generated as a result of detailed retrospective checking, but some more limited revision is needed for notified voluntary departures to allow time for recording notifications from those who have departed. In light of this, other confirmed voluntary departures for the second and third quarter of 2013 have been revised upwards, from 8,277 to 10,772 (+30%) and notified voluntary departures from 4,146 to 4,393 (+6%) in this quarterly release.
Within the European Economic Area section, data on approvals for registration certificates and accession worker cards, for the second and third quarters of 2013 have been updated (in light of further decisions made) upwards compared with data previously published; for the two quarters, registration certificates have been revised from a total of 3,300 to 5,725 and accession worker cards from 718 to 843 as part of the expected update process. Data on Seasonal Agricultural Worker cards issued in the first 3 quarters of 2013 have been updated from 18,043 to 19,372 following updates to the administrative database.
15.4 Future changes
The following changes are planned, subject to data quality and available resources:
EEA topic: Migration Statistics anticipate that the EEA section of this release will be discontinued during 2014, following the end of transitional controls for the EU2 nationals (Bulgaria and Romania). Information on other aspects of EEA migration, such as passenger arrivals and data regarding Croatian transitional arrangements will continue to be collected and published in other sections.
The Office for National Statistics have set out at ‘Bulgarian and Romanian migration to the UK in 2014’ the timetable for release of information on EU2 migration following the lifting of transitional controls on 1 January 2014.
Detention topic: Migration Statistics plan to publish data on people held in prison solely under Immigration Act powers during 2014 but a release date had not yet been finalised. Migration Statistics also plan to discontinue release of data on numbers of families with children in detention as this is not a count of individuals and so is of limited value (Table dt 14 q) but data on children in detention will continue to be published on a monthly and quarterly basis.
Extensions by previous status: Migration Statistics are considering updating the extensions of stay analysis of students switching into work, possibly annually, subject to user demand and data quality.
Asylum: Figures for Unaccompanied Asylum Seeking Children and Age Disputed Cases (Tables as 08 to as 10 q) from 2006 to 2011 have been revised following a change to the counting methodology for these figures. The figures in the latest published tables have been produced using the revised counting methodology and consequently are not directly comparable with earlier data.
If you have any comments on these plans please contact us via the Migration Statistics Enquiries inbox.
15.5 Migration Statistics User Forum
The Forum has been established for discussion of migration statistics, allowing users to discuss their need for and use of the data and for producers to consult on presentation and changes. The main focus is on figures for the UK, but this would not exclude discussion of migration statistics for other countries. Home Office Statistics intends to use this list for communication with users, including data and release developments. The Forum is a user led group, with close to 200 members, that is now affiliated to the Royal Statistical Society.
The list also provides access to contact details for the Home Office’s Migration Statistics team via downloading from the MIGRATION-STATS File Area.
The distribution list is available to join through the MIGRATION-STATS JISCmail list.
Copies of the presentations made at the last annual conference of the Forum, held on 17 September 2013, including discussion of the then position on e-borders data, are available via the MIGRATION-STATS JISCmail website conference page.
The next annual conference of the Migration Statistics User Forum conference is planned for 16 September 2014. If you would like to contribute to organising the conference or offer a presentation, please contact us at MigrationStatsEnquiries@homeoffice.gov.uk. Details of the planned agenda and how to register will be made available closer to the date via the JISCmail list .
15.6 Public Administration Select Committee inquiry
The Public Administration Select Committee (PASC) has examined the topic of migration statistics, as part of a programme of work on statistics and their use in government, and has published a report, PASC migration statistics.
15.7 Home Office statistical work programme
The Home Office has published its Statistical Work Programme 2013/14 which outlines the most significant outputs, highlights some recent developments and outlines future plans. Pages 3 to 4 of the Work Programme cover our statistics on immigration. Pages 11 to 12 of the Work programme provide details of how you can provide feedback on the work programme and outputs.
15.8 Further information and feedback
If you have any questions or comments about this release, please send an email to: MigrationStatsEnquiries@homeoffice.gov.uk
Or write to:
The Editor, Immigration Statistics
Migration Statistics
Home Office Statistics
17th Floor Lunar House
40 Wellesley Road
Croydon
CR9 2BY
Press enquiries should be made to:
Home Office Press Office
Peel Building
2 Marsham Street
London
SW1P 4DF
Tel: 020 7035 3535
The Home Office Responsible Statistician is David Blunt, Chief Statistician and Head of Profession for Statistics.
16. About the figures
This section, About the figures, provides extra information designed to assist in the interpretation of this release.
The User Guide to Home Office Immigration Statistics additionally provides more detailed information including definitions used, other sources of information, how figures are compiled, data quality and issues arising from figures based on data sourced from an administrative database. The User Guide is structured in the same way as About the figures.
For further information on changes to immigration legislation affecting the statistics see the Policy and Legislative Changes Timeline published alongside the User Guide.
16.1 Work
A range of measures can be used to monitor those who are subject to immigration control and are coming to the UK to work. These include:
- issues of visas for entry clearance, providing information on those intending to come
- admissions data, providing information on migrants at the border
- estimates on non-EU immigration from the International Passenger Survey (IPS) on migrants intending to stay for at least a year for work purposes
In addition, grants of (in-country) extensions of stay for work purposes provide information on migrants in-country, while work-related grants of settlement provide a measure of longer-term migration.
Trends in extensions and in permission to stay permanently will depend on admissions and immigration in previous years.
ONS figures on long-term immigration in this topic relate to non-EU nationals whilst other figures (visas, admissions, extensions, permission to stay permanently) relate to non-EEA nationals.
The various statistics and research presented can appear to give different pictures of immigration for work. Often this is because the latest data for different measures cover different time periods. In addition, they also count different aspects of the immigration process, with some showing intentions or permissions, while others show actual events.
Data includes dependants unless stated otherwise.
Recent falls for work-related visas, admissions and immigration are likely to be partly due to policy changes that came into effect from 2011. The Post-Study work route was closed to new applications on 6 April 2012 but existing applications continue to be processed after this date. From December 2010, Tier 1 General was closed to applicants who are outside the UK and it was closed to migrants who were already in the UK, in most immigration categories, from April 2011. Details of these policy changes, together with information on changes to immigration legislation affecting the statistics, can be found in the Policy and Legislative Changes Timeline published alongside the User Guide.
IPS data for 2012 are final. All other data for 2012 and 2013 are provisional.
Figures for admissions and immigration are estimates rounded to the nearest thousand.
16.2 Study
There are a range of measures that can be used to monitor those who are subject to immigration control and are coming to the UK to study. These include:
- applications and issues of (entry clearance) visas, providing information on those intending to come
- admissions data, providing information on migrants at the border
- estimates on non-EU immigration from the International Passenger Survey (IPS) on migrants intending to stay for at least a year for study purposes
Data for visas and admissions exclude student visitors unless stated otherwise. The student visitor category provides for persons who wish to come to the UK as a visitor and undertake a short period of study. Visa data on student visitors include those who applied on the ‘short-term student’ endorsement prior to the introduction of the ‘student visitor’ endorsement in September 2007. For admissions short-term students may have been classified as visitors prior to September 2007; for consistency and comparability over time they are excluded from study-related totals.
In addition, grants of (in-country) extensions of stay for study purposes provide information on migrants in-country. Trends in extensions will depend on admissions and immigration in previous years.
Figures for immigration in this topic relate to non-EU nationals whilst other figures (visas, admissions, extensions) relate to non-EEA nationals.
The various statistics for those coming to the UK to study can appear to give different pictures of student immigration. Often this is because the latest data for different measures cover different time periods. In addition, they also count different aspects of the immigration process, with some showing intentions or permissions, while others show actual events.
Data include dependants unless stated otherwise.
IPS data for 2012 are final. All other data for 2012 and 2013 are provisional.
Figures for admissions and long-term immigration in this briefing are estimates rounded to the nearest thousand.
16.3 Family
There are a range of measures that can be used to monitor those coming to the UK for family reasons who are subject to immigration control. These include:
- issues of visas for entry clearance, providing information on those intending to come
- admissions data, providing information on migrants at the border
- settlement data, providing information on the number of people who are granted or refused permission to stay permanently
- estimates on non-EU immigration from the International Passenger Survey (IPS) on migrants intending to stay for at least a year to accompany or join someone else, including family
In addition, grants of (in-country) extensions of stay granted to those on the ‘family route’ provide information on migrants already in the UK.
Immigration figures estimated by the IPS relate to non-EU nationals, whilst other figures on visas, extensions and settlement relate to non-EEA nationals
The numbers of applications and decisions made reflect changes in levels of immigration over time, as well as policy and legislative changes, including changes to immigration legislation. The availability and allocation of resources within UK Visas and Immigration can also affect the number of decisions on applications. In July 2012, changes were made to the family Immigration Rules which apply to applications made on or after 9 July 2012. It is not possible to separately identify applications made under the previous and new rules. Spouse, partner and child applications which fall for refusal solely because they do not meet the new minimum income threshold have been subject to a hold on decision making following a High Court judgement in July 2013.
The various statistics for those coming to the UK for family reasons can appear to give different pictures of immigration. This can be because the latest data for different measures cover different time periods. In addition, they also count different aspects of the immigration process, with some showing intentions or permissions, while others show actual events. For example, the number of passengers recorded as entering the country for family reasons are much lower than the number of visas issued. The Before Entry and Settlement sections of the User Guide to Home Office Immigration Statistics include a discussion on the differences between the various data sources presented on immigration for family reasons.
All data for 2012 and 2013 are provisional (2012 IPS data are final).
Figures for non-EU immigration estimated by the IPS are rounded to the nearest thousand.
The IPS, run by the Office for National Statistics (ONS), also provides estimates for the number of people immigrating to the UK who state that the main reason is to accompany or join someone else, including family members, and have the intention of staying for a year or more.
16.4 Before Entry
Before travelling to the UK, a person may be required to apply for and be issued with an entry clearance visa, depending on their nationality, purpose of visit and intended length of stay. On arrival at UK ports, or UK border controls in France and Belgium (often termed ‘juxtaposed’ controls), all individuals have to satisfy a Border Force officer that they have the right to enter the country before being admitted to the UK.
The data in this section include dependants and exclude those visiting the UK or in transit, unless stated otherwise.
Data for visas prior to 2005 are not comparable. All figures for 2012 and 2013 are provisional.
The refusal of entry to passengers relates to non-asylum cases dealt with at ports of entry.
16.5 Admissions
All people admitted are subject to immigration control except British, other European Economic Area (EEA) and Swiss nationals.
Most data in this briefing are rounded to three significant figures. All data include dependants.
For arriving passengers subject to immigration control, who have previously obtained leave to enter, the journey is recorded as ‘returning after a temporary absence abroad’ within the ‘other’ category. Due to the volume of passengers arriving at Heathrow and Gatwick some data are estimated from monthly samples.
Some major components of the total (visitors, passengers returning and passengers in transit) reflect, to a large extent, trends in international tourism. The number of other admissions (for example, for work, study or family reasons) are likely to reflect trends in international migration and related policy and legislative changes affecting those subject to immigration control, for example changes in immigration legislation, enlargement of the European Union, and the introduction of the points-based system for work and study in 2008 and 2009 respectively.
Total passenger arrival data are available up to the year ending September 2013 (Table ad 01 q); data on the purpose of journey (e.g. visit, work, study; Table ad 02 q); and data for individual nationalities are available up to the end of 2012 (Table ad 03).
Further briefing on those arriving who are not subject to immigration control is available in the ‘EEA’ section.
Further information on visitors to the UK is published by the Office for National Statistics in ‘Overseas Travel and Tourism– September 2013’.
16.6 Asylum
This briefing excludes numbers of dependants, unless stated otherwise. One person (the main applicant) can apply for asylum on behalf of themselves and others (dependants).
All data, except data on asylum support, for 2012 and 2013 are provisional.
16.7 Extensions of stay
EEA nationals are not subject to immigration control so are not included in these figures. When a country joins the EU its nationals are no longer included in these figures e.g. Bulgarian and Romanian nationals are not included from 2007 onwards.
The data in this briefing include dependants, except where stated otherwise, and take account of the outcomes of reconsiderations and appeals. All figures for 2012 and 2013 are provisional.
The numbers of applications and decisions made reflect changes over time in levels of immigration, as well as policy and legislative changes, including changes to immigration legislation. The availability and allocation of resources within Home Office can also affect the number of decisions.
Data on migration applications decided within published standards, the cost per decision for all permanent and temporary migration applications and the size of the controlled archive are published as Official Statistics by the Home Office as part of their performance data. Details, including an explanation of what the controlled archive contains, are given on the Home Office website, Our performance.
A short statistical article on ‘Extensions of stay by previous category’ has also been published alongside the Immigration Statistics April to June 2013 release to provide further detailed information.
16.8 Settlement
EEA nationals are not subject to immigration control and so are not included in these figures. When a country joins the EU its nationals are no longer in these figures e.g. Bulgarian and Romanian nationals are not included from 2007 onwards.
The numbers of applications and decisions about permission to permanently stay reflect changes over time in levels of those entering the country, as well as policy and legislative changes. These may affect the number of people potentially eligible to permanently stay. The availability and allocation of resources within the Home Office can also affect the number of decisions.
All the figures include spouses and dependants, unless stated otherwise. All data for 2012 and 2013 are provisional.
From 2003 onwards, dependants of EEA and Swiss nationals in confirmed relationships may be shown separately in figures on issues and refusals of permanent residence documents, rather than in figures about settlement. Figures on issues and refusals of permanent residence documentation to EEA nationals and their family members are shown in EEA table ee 02 in the European Economic Area topic.
Data on migration applications decided within published standards, the cost per decision for all permanent and temporary migration applications and the size of the controlled archive are published as Official Statistics by the Home Office as part of their immigration performance data. Details, including an explanation of what the controlled archive contains, are given on the Our Performance webpage.
Migrant journey analysis is able to look at those who apply for settlement or indefinite leave to remain (ILR) and which visas they used to arrive at that point. This analysis shows that the proportion of settlement grants made to people who initially arrived on a temporary visa rose between 2009 and 2012. For example, those originally entering the UK on a student visa comprised 11% of settlement grants in 2009 and 16% in 2012. Source: Home Office, Migrant journey: fourth report.
16.9 Citizenship
There are no separate figures for dependants because all applications for citizenship are from individuals treated as applicants in their own right (including those made on the basis of a relationship with an existing British citizen). The data also reflect the outcome of reconsidered decisions. All figures for 2012 and 2013 are provisional.
Citizenship is granted under the British Nationality Act 1981 which came into force on 1 January 1983, subsequently amended by the Nationality, Immigration and Asylum Act 2002.
The number of applications and decisions made reflect changes over time in levels of those entering the country, as well as policy and legislative changes, which for example may affect the number of people potentially eligible to apply. The availability and allocation of resources within the Home Office can also affect the number of decisions.
16.10 Detention
Children are those recorded as being under 18 years of age. All data for 2012 and 2013 are provisional.
16.11 Removals and voluntary departures
Numbers of enforced removals include people deported. Deportations are a subset of departures which are enforced either following a criminal conviction or when it is judged that a person’s removal from the UK is in the public’s interest; a person who has received a deportation order is not allowed to return to the UK, unless the order is cancelled. Most illegal immigrants are removed from the UK under administrative or illegal entry powers and not deported. Published information on those deported from the UK is not separately available.
The other confirmed voluntary departures and notified voluntary departures for the second and third quarter of 2013 have been revised upwards from 8,277 to 10,772 (30% increase) and from 4,146 to 4,393 (6% increase) respectively in this quarterly release.
All data include dependants, unless otherwise stated and are provisional for 2012 and 2013.
16.12 European Economic Area
The Home Office, ‘Migration: Bulgarian and Romanian workers’ has previously indicated that restrictions on Bulgarians and Romanians would end on 31 December 2013.
Following the accession of Croatia to the EU on 1st July 2013 similar transitional restrictions to those that previously related to Bulgarians and Romanians were placed on Croatians working in the UK. A link to more information on these restrictions can be in the User Guide to Home Office Immigration Statistics.
Figures for admissions and immigration in this briefing are estimates rounded to the nearest thousand. Relevant tables provide unrounded data (except for admissions data and IPS estimates).
All data for 2012 and 2013 are provisional (2012 IPS data are final).
EEA nationals do not require an entry clearance visa. Slightly over 460 visas were recorded as issued to EEA nationals in 2012, with 419 of these recorded as nationals of Cyprus, but most likely these people are from the area not under the effective control of the Republic of Cyprus. The ‘Before entry’ data tables and section of the User Guide to Home Office Immigration Statistics provide more information.
Passenger arrivals figures for 2001 to 2003, referred to in the chart above, can be found in Table 1.2 of ‘Control of Immigration Statistics UK 2009’.
There continued to be small numbers of EEA nationals (including dependants) seeking asylum, a total of 229 in 2013. More than half of these applicants were of Polish nationality (139). In the year 2013, a number of EEA nationals (2,191 enforced removals, 945 refused entry at port and subsequently departed and 260 voluntary departures) were removed or departed voluntarily. European legislation generally sets higher thresholds for deporting EEA nationals than exist for other foreign nationals.