Asylum
Published 26 November 2015

© Crown copyright 2015
This publication is licensed under the terms of the Open Government Licence v3.0 except where otherwise stated. To view this licence, visit nationalarchives.gov.uk/doc/open-government-licence/version/3 or write to the Information Policy Team, The National Archives, Kew, London TW9 4DU, or email: psi@nationalarchives.gov.uk.
Where we have identified any third party copyright information you will need to obtain permission from the copyright holders concerned.
This publication is available at https://www.gov.uk/government/statistics/immigration-statistics-july-to-september-2015/asylum
Valid: 26 November 2015 to 24 February 2016
All data below relate to the year ending September 2015 and all comparisons are with the year ending September 2014, unless indicated otherwise.
Back to ‘Immigration statistics July to September 2015’ content page.
This is not the latest release. View latest release.
1. Key facts
Asylum applications from main applicants increased by 19% to 29,024 in the year ending September 2015, the highest number of applications since the year ending June 2005 (30,314). The largest number of applications for asylum came from nationals of Eritrea (3,726), followed by Sudan (2,842), Iran (2,407) and Syria (2,402). Grant rates vary between nationalities; for example, at initial decision, the grant rate for nationals of Sudan was 84%, compared with 21% for Pakistani nationals.
Most applications for asylum are made by people already in the country (91% of applications in the year ending September 2015) rather than on arrival in the UK at a port. The majority of applicants tend to be young and male.
In the year ending September 2015, the number of initial decisions on asylum applications increased by 87% to 29,246, following a reallocation of case-working resources to this area, slightly more than the total number of applications received. Of these decisions, 41% (12,011) were grants of asylum or an alternative form of protection, compared with 38% in the previous year. This is the highest number of grants since the year ending September 2003 (15,556).
In addition, a total of 776 people were resettled in the UK in the year ending September 2015. Of these, 162 (252 since the scheme began) were granted humanitarian protection under the Syrian Vulnerable Persons Relocation Scheme. On 7 September, the Prime Minister announced an expansion to the existing Syrian Vulnerable Persons Relocation Scheme. Through this expansion, it is expected that 20,000 Syrians in need of protection will be resettled in the UK by 2020.
Estimated figures show the UK had the seventh highest number (36,000) of asylum applications within the EU in the year ending September 2015, including dependants. Germany (318,000), Hungary (190,000) and Sweden (94,000) were the top 3 receiving EU countries.
2. Asylum applications and initial decisions for main applicants
| Year | Total applications | Total initial decisions | Granted (1) | Granted as a % of initial decisions | Refused | Refused as a % of initial decisions |
|---|---|---|---|---|---|---|
| Year ending September 2011 | 19,225 | 18,238 | 5,584 | 31% | 12,654 | 69% |
| Year ending September 2012 | 20,890 | 16,569 | 5,937 | 36% | 10,632 | 64% |
| Year ending September 2013 | 23,805 | 18,728 | 6,975 | 37% | 11,753 | 63% |
| Year ending September 2014 | 24,324 | 15,653 | 5,968 | 38% | 9,685 | 62% |
| Year ending September 2015 | 29,024 | 29,246 | 12,011 | 41% | 17,235 | 59% |
| Change: latest year | +4,700 | +13,593 | +6,043 | - | +7,550 | - |
| Percentage change | +19% | +87% | +101% | - | +78% | - |
Table notes
Source: Home Office, Immigration Statistics July to September 2015, Asylum table as 01 q.
(1) Granted includes grants of asylum, humanitarian protection, discretionary leave, leave to remain under family life or private life rules, leave outside the rules and UASC leave.
3. Long-term trends in asylum applications for main applicants
The chart below shows the annual number of asylum applications made since 2001.
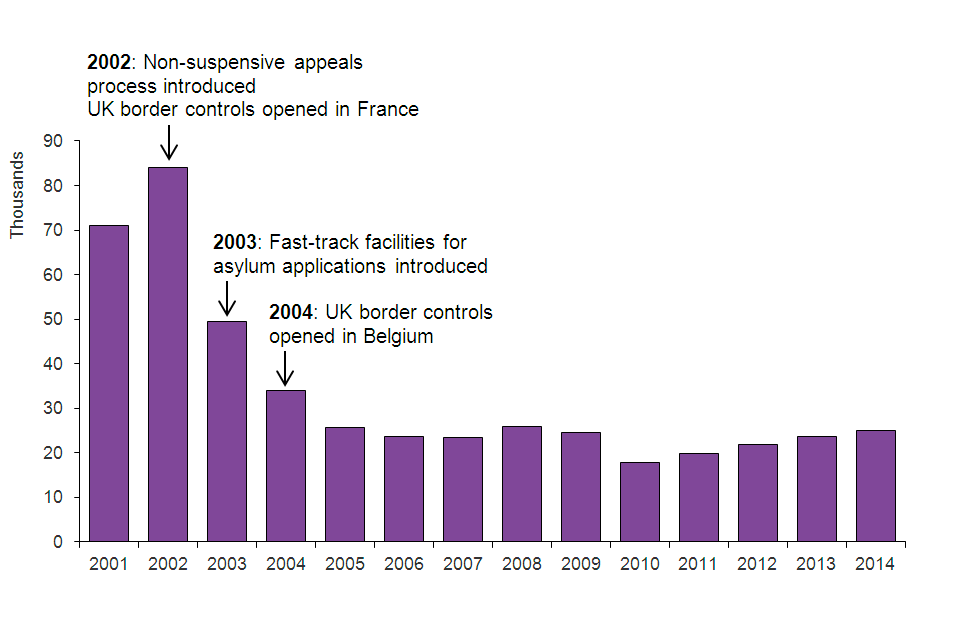
The chart shows the number of asylum applications made between 2001 and the latest calendar year. 2002: Non-suspensive appeals process introduced; UK border controls opened in France. 2003: Fast-track facilities introduced.
4. Nationalities applying for asylum
In the year ending September 2015, the largest number of applications for asylum came from nationals of Eritrea (3,726), followed by Sudan (2,842), Iran (2,407) and Syria (2,402). In the same period, the number of asylum applications from Sudanese nationals more than doubled to 2,842, from 1,216 in the year ending September 2014.
World events have an effect on which nationals apply for asylum at any particular time. For example, the number of applicants from Syria has increased sharply following the outbreak of the Syrian civil war in early 2011. The 2,402 applications for asylum from Syrian nationals in the year ending September 2015 compares with only 244 in the year ending September 2011. In addition, increasing numbers of people have sought asylum from Eritrea, mirroring the increased international concern over human rights within that country. In the year ending September 2015, there were 3,726 asylum applications from nationals of Eritrea compared to 831 in the year ending September 2011.
The grant rate at initial decision for Eritrean nationals has recently dropped, coinciding with the publication of updated country information and guidance on illegal exit and national service in Eritrea in March 2015. In the year ending September 2015, the proportion of initial decisions for Eritrean nationals that were grants of asylum or an alternative form of protection was 61%, compared with 84% in the previous 12 months. This has been reflected in an increase in the number of appeals lodged by Eritrean nationals, from 108 in the year ending September 2014 to 1,346 in the year ending September 2015. Of appeals determined in the year ending September 2015, 72% of those by Eritrean nationals were allowed; almost double the 37% in the previous year.
Grant rates for asylum, humanitarian protection, discretionary leave or other grants of stay vary considerably between nationalities. For example, 87% of the total decisions made for nationals of Syria were grants, compared with 21% for Pakistani nationals.
Top 5 nationalities applying for asylum, year ending September 2015 compared with year ending September 2014
| Ranking Year ending September 2015 (Year ending September 2014) | Nationality | Year ending September 2014 | Year ending September 2015 | Grant rates based on initial decisions |
|---|---|---|---|---|
| 1 (1) | Eritrea | 2,924 | 3,726 | 61% |
| 2 (7) | Sudan | 1,216 | 2,842 | 84% |
| 3 (3) | Iran | 1,991 | 2,407 | 57% |
| 4 (4) | Syria | 1,754 | 2,402 | 87% |
| 5 (2) | Pakistan | 2,901 | 2,391 | 21% |
Table notes
Source: Home Office, Immigration Statistics July to September 2015, Asylum table as 01 q.
(1) Grant rates relate to the number of grants for asylum, humanitarian protection, discretionary leave or other grants of stay as a proportion of all initial decisions made in the year ending September 2015.
5. Resettlement
In addition to those asylum seekers who apply in the UK, resettlement schemes are also offered to those who have been referred to the Home Office by UNHCR (the UN agency for refugees). In the year ending September 2015, a total of 776 were resettled in the UK through this process. Of these, 162 were also granted humanitarian protection under the Syrian Vulnerable Persons Relocation Scheme (VPRS). A total of 252 people have been granted humanitarian protection under the Syrian VPRS since the scheme began. On 7 September, the Prime Minister announced an expansion to the existing Syrian VPRS. Through this expansion, it is expected that 20,000 Syrians in need of protection will be resettled in the UK by 2020.
6. International comparisons
Figures in this section are based on data supplied by the individual countries to the Intergovernmental Consultations on Migration, Asylum and Refugees (IGC), UNHCR and Eurostat. Not all countries provide the latest data in time for each release of these Immigration Statistics. Where a figure is unavailable for a given month, we estimate it using the average of the last 3 months available, unless the time series is erratic, when we use the average of the last 12 months.
Including dependants, the estimated total number of asylum applications to the European Union in the year ending September 2015 was an estimated 972,000, an increase of 89% compared with the previous 12 months (514,000).
Top EU countries receiving asylum applications, year ending September 2015
(Total number of applications 972,000 including dependants; some estimated data)
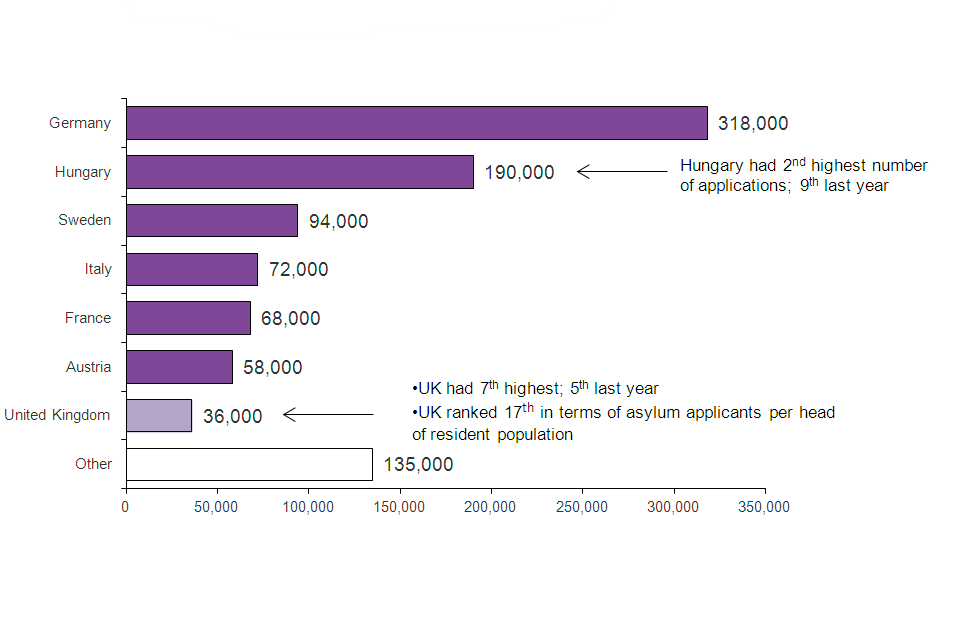
The chart shows the top 7 EU countries receiving asylum applications in the year ending September 2015. Germany received 9 times as many applications as the UK. Hungary had 2nd highest number of applications; 9th last year.
Chart notes
Source: Home Office, Immigration Statistics July to September 2015, Asylum table as 07 q.
(1) Figures are rounded to the nearest 1,000 and so may not sum to the total.
(2) The estimated figures in this chart are based on data supplied to IGC and UNHCR.
In the second quarter of 2015 (April to June), the latest provisional Eurostat data, Asylum quarterly report, show that the top 3 nationalities of those seeking asylum in the EU as a whole were Syrian, Afghan and Albanian. The highest number of first-time asylum applications in April to June 2015 were registered in Germany (80,900 applications, or 38% of total applications in the EU), Hungary (32,700; 15%) and Austria (17,400; 8%). The UK received 7,500 first-time applications; 3.5% of the EU total. Germany received 16,000 applications from Syrians and 15,000 from Albanians, followed by Kosovans (7,000) and Iraqis (5,000).
Between April and June 2015, the proportion of positive asylum decisions (for all nationalities) in Germany was 43%, compared with 40% in the UK and just 16% in Hungary (where the number relates to 700 decisions in quarter 2, compared with 46,000 in Germany). The average grant rate for a particular member state will reflect the nationalities applying for asylum in that country and their respective likelihood of being accepted as refugees. In Germany, the nationalities with the highest number granted refugee status between April and June 2015 were Syrian (13,000) and Iraqi (3,000). In Hungary, the top nationalities for asylum applications were Afghan (14,000) and Syrian (8,000), however the grant rate was lower for Afghanistan nationals (32% and 68% respectively).
7. Outcome of asylum applications
The most recent data report on initial decisions made on asylum applications. However, some decisions will be challenged at the HM Courts and Tribunals Service (HMCTS), an executive agency of the Ministry of Justice, which considers appeals against the asylum decisions made by the Home Office.
The Home Office produces an analysis of applications for whole year cohorts of asylum seekers, in order to present the overall success rates following appeal. For most years, this will provide the most complete description of the outcome for asylum seekers; however, for the most recent years some cases will still be outstanding, as they have had less time to be processed. The analysis therefore only provides a “snapshot” of the recorded outcomes of the group (or cohort) of asylum applicants in any one year, at a particular time. This dataset is updated, in full, annually and is currently available up to 2014.
7.1 Outcome of applications made between 2011 and 2013
The following chart gives an illustration of outcomes in the asylum system in the UK, for applications made in the years 2011 to 2013 (inclusive), where the outcome is known.
Indicative flows through the UK asylum system, where outcomes known, 2011–2013 data
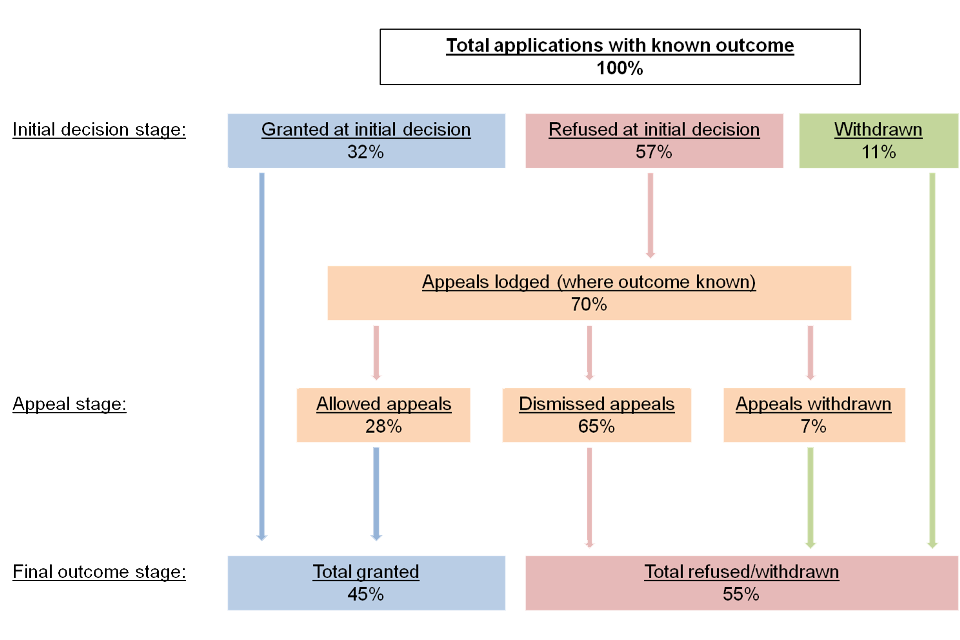
This flow chart shows indicative flows through the UK asylum system, where outcomes known, 2011–2013 data.
Chart notes
(1) Assumes all appeals lodged are as a result of a refused application. Latest data for 2011 to 2013 show 70% of all refusals resulted in an appeal being lodged.
(2) Figures are derived by combining data from the 2011, 2012 and 2013 cohort data from Table as 06.
(3) Cases where initial decision or appeal outcomes are unknown are not included in this analysis.
7.2 Currently recorded outcomes for 2014 applications
Of the 25,033 main applicants who applied for asylum in 2014, 20,585 initial decisions had been made as at August 2015 when the statistics were compiled, including 9,230 grants and 11,355 refusals. 8,436 appeals were lodged against decisions made on applications from 2014. Of these, 42% (3,553) were dismissed, 19% (1,635) were granted asylum or another form of protection and 38% were withdrawn or the outcome was unknown at the time the statistics were compiled.
The outcomes for the 2014 cohort, as with previous years, will be updated in subsequent annual reports. However, of the 25,033 applications made in 2014, as at August 2015 when these statistics were compiled, it is estimated that 10,865 (43%) had been granted asylum, humanitarian protection or discretionary leave either at initial decision or after appeal; 8,634 (34%) cases had been refused; and around a fifth (22%; 5,534) were awaiting confirmation of an initial decision.
Outcome of asylum applications, by year of application
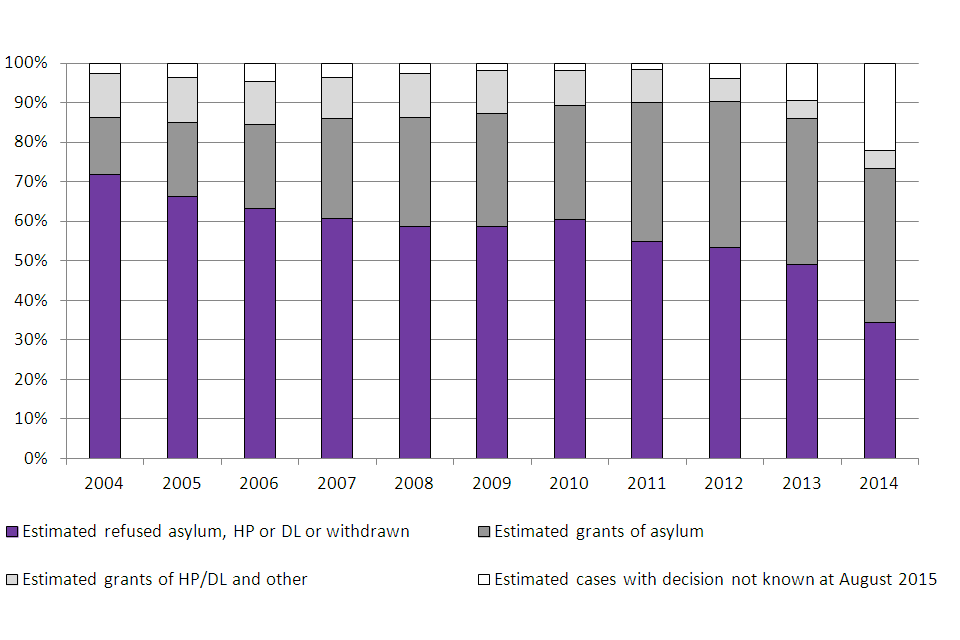
The chart shows the outcome of asylum applications made between 2004 and the latest calendar year as at August 2015. The data are available in Table as.06.
Chart notes
Source: Home Office, Immigration Statistics July to September 2015, Asylum table as 06.
(1) Chart shows the proportion of recorded outcomes of applications made in 2014, as at August 2015.
(2) Due to the large variety of routes that an asylum application can take to a final outcome, the analysis of the outcomes of asylum applications in any one year requires interpretation for a small percentage of cases. The proportions and underlying figures for final outcomes of the analysis of applications for the group (or cohort) of applicants in any one year, are therefore estimated.
(3) The proportion of applications awaiting the outcome of an initial decision or an appeal will inherently be lower in earlier years as there has been longer for the case to be processed than those from more recent years.
The overall proportion of applications granted asylum or a form of temporary protection either at initial decision or after having an appeal allowed, was estimated to be 26% in 2004; this proportion has steadily increased to 43% of applications made in 2014 (where the outcome is known), as shown in the above chart.
In addition, the outcome analysis also shows how the final grant rates vary by country of nationality. For example, in 2014, 78% of Eritrean nationals applying in 2014 were granted asylum or another form of protection following initial decision and after appeal, compared with 25% of Pakistani applicants.
8. Support provided to asylum seekers
At the end of September 2015, 31,896 asylum seekers and their dependants were being supported in the UK under Section 95 (either in supported accommodation or receiving subsistence support), compared with 27,815 at the end of September 2014. Although this number has risen since 2012, the figure remains considerably below that for the end of 2003 (the start of the published data series), when there were 80,123 asylum seekers in receipt of Section 95.
The number of asylum seekers in receipt of Section 95 support are available by local authority, as at the end of each quarter, in table as_16_q of the Asylum data tables volume 4: tables as 14 to as 19 q.
Asylum seekers in receipt of Section 95 support, by local authority, per million population, as at end of September 2015
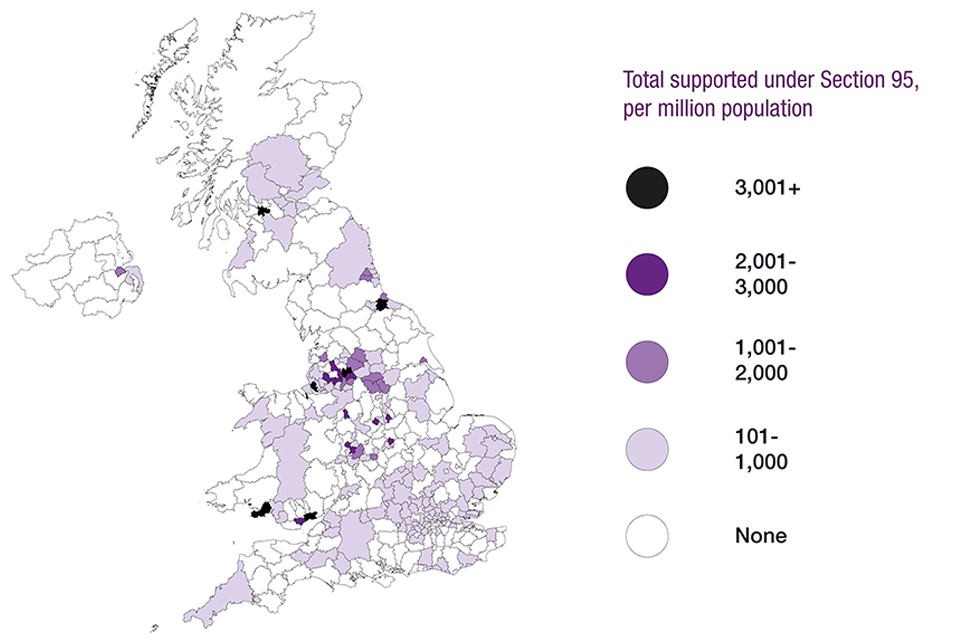
This map shows the number of asylum seekers in receipt of Section 95 support, by local authority, per million population, as at end of September 2015.
Chart notes
Source: Home Office, Immigration Statistics July to September 2015, Asylum table as 17 q; Population figures sourced from the ONS 2014 Mid-year population estimates, published 25 June 2015.
There were 4,173 failed asylum seekers and their dependants receiving support (under Section 4) at the end of September 2015. Failed asylum seekers (main applicants only) receiving support under Section 4 peaked at the end of September 2009 (12,019).
9. Applications pending
At the end of September 2015, 24,236 of the applications received since April 2006 from main applicants were pending a decision (initial decision, appeal or further review), slightly more than at the end of September 2014 (22,879, up 6%). The increase was largely accounted for by a rise in the number pending further review (+85%).
Since January 2014, the Home Office has taken steps to reallocate resources to this area of work and this has been reflected in the 87% (13,593) rise in the number of initial decisions on asylum applications for the year ending September 2015.
10. Asylum appeals
The HM Courts and Tribunals Service received 13,912 asylum appeals from main applicants in the year ending September 2015, a 111% rise compared with the year ending September 2014 (6,606) reflecting the higher number of decisions in this period.
Appeal determinations have increased from 6,267 in the year ending September 2014 to 8,823 in the year ending September 2015. This remains below the peaks in the number of appeals (16,560) and the number of determinations (16,032) in the year ending June 2010. In the year ending September 2015, the proportion of determined appeals that were dismissed was 62%, while 33% of appeals were allowed and 5% were withdrawn.
11. Unaccompanied Asylum-Seeking Children (UASC)
An Unaccompanied Asylum-Seeking Child (UASC) is a person under 18, or who, in the absence of documentary evidence establishing age, appears to be under that age, is applying for asylum on his or her own right and has no relative or guardian in the United Kingdom. There were 2,564 asylum applications from UASC in the year ending September 2015, an increase of 50% from the year ending September 2014 (1,712). These applications represented 9% of all main applications for asylum in the year ending September 2015. Despite the recent increase in UASC applications, they remain below the peak of 4,060 in the year ending September 2008.
There were 1,956 initial decisions for UASC in the year ending September 2015, 109% more than in the year ending September 2014 (937). Of these, 68% were grants, similar to the 69% grant rate in the previous year.
12. Age disputes
Some asylum applicants claim to be children but there may be doubts as to whether this is in fact the case. In the year ending September 2015, 590 asylum applicants had their age disputed and there were 574 recorded as having an age assessment. Of those who completed age assessments in the year ending September 2015, 65% had a date of birth showing that they were over 18, despite claiming to be a child when the age dispute was raised.
13. Dependants
Including dependants, the number of asylum applications increased from 31,546 in the year ending September 2014 to 35,474 in the year ending September 2015, an increase of 12% and an average of 1 dependant for every 4 main applicants. In the same period, 9,675 initial decisions were made relating to dependants. Of these 2,610 (27%) were granted asylum, or a form of temporary protection or other type of grant, and 7,065 (73%) were refused.
14. Data tables
Data referred to here can be found in the following tables:
Asylum vol. 1: tables as 01 to as 02.
The following tables are included in this volume:
as 01 Asylum applications and initial decisions for main applicants, by country of nationality
as 01 q Asylum applications and initial decisions for main applicants, by country of nationality
as 02 Asylum applications and initial decisions for main applicants and dependants, by country of nationality
Asylum vol. 2: tables as 02 q to as 06.
The following tables are included in this volume:
as 02 q Asylum applications and initial decisions for main applicants and dependants, by country of nationality
as 03 Asylum applications from main applicants, by age, sex and country of nationality
as 04 Asylum applications from main applicants and dependants, by age, sex and country of nationality
as 05 Asylum initial decisions from main applicants, by sex and country of nationality
as 06 Outcome analysis of asylum applications, as at August 2015
Asylum vol. 3: tables as 07 to as 13 q.
The following tables are included in this volume:
as 07 Asylum applications received in Europe and elsewhere for main applicants and dependants
as 07 q Asylum applications received in Europe and elsewhere for main applicants and dependants
as 08 Asylum applications received from Unaccompanied Asylum-Seeking Children, excluding dependants, by sex and age at time of application
as 08 q Asylum applications received from Unaccompanied Asylum-Seeking Children, excluding dependants, by sex and age at time of application
as 09 Initial decisions on asylum applications from Unaccompanied Asylum-Seeking Children, excluding dependants, by sex and age at initial decision
as 09 q Initial decisions on asylum applications from Unaccompanied Asylum-Seeking Children, excluding dependants, by sex and age at initial decision
as 10 Age disputes raised and resolved for asylum applicants, by country of nationality
as 10 q Age disputes raised and resolved for asylum applicants, by country of nationality
as 11 Asylum main applicants accepted onto the fast-track process, by country of nationality
as 12 Outcomes of asylum main applicants accepted onto the fast-track process
as 13 q Main applicants refused asylum and eligible for the non-suspensive appeals process, by country of nationality
Asylum vol. 4: tables as 14 to as 19 q.
The following tables are included in this volume:
as 14 Asylum appeal applications and determinations, by country of nationality and sex
as 14 q Asylum appeal applications and determinations, by country of nationality
as 15 Applications for asylum support, by support type and nationality
as 16 q Asylum seekers in receipt of Section 95 support, by local authority, as at end of quarter
as 17 q Asylum seekers in receipt of Section 95 support, by country of nationality and UK region, as at end of quarter
as 18 q Asylum seekers in receipt of Section 4 or Section 98 support, and decisions to grant Section 4 support
as 19 q Refugees (and others) resettled, including dependants
15. Background Information
This section covers asylum applications, initial decisions, appeals, Unaccompanied Asylum-Seeking Children (UASCs), age disputes, support, resettlement and international comparisons.
15.1 Migration Transparency Data webpage
A range of key input and impact indicators are currently published by the Home Office on the Migration Transparency Data webpage.