Guide to road safety and contributory factors for reported road casualties Great Britain
Updated 30 July 2026

© Crown copyright 2026
This publication is licensed under the terms of the Open Government Licence v3.0 except where otherwise stated. To view this licence, visit nationalarchives.gov.uk/doc/open-government-licence/version/3 or write to the Information Policy Team, The National Archives, Kew, London TW9 4DU, or email: psi@nationalarchives.gov.uk.
Where we have identified any third party copyright information you will need to obtain permission from the copyright holders concerned.
This publication is available at https://www.gov.uk/government/publications/guide-to-contributory-factors-for-reported-road-casualty-statistics/guide-to-contributory-factors-for-reported-road-casualties-great-britain
About this guidance
This guidance explains how contributory factors (CFs) and road safety factors (RSFs) are recorded within STATS19 and how the transition from CFs to RSFs affects interpretation of the statistics. CFs were first added to the data collection from 2005, to provide insight into reasons why collisions occur. As a result of recommendations in the 2018 STATS19 review, the collection system is changing from CFs to the newer RSFs, which have been designed to facilitate more consistent recording. Because some police forces still record CFs while others now record RSFs, direct comparisons over time and between areas may not be reliable. This guidance explains the department’s recommended approach to analysing and interpreting the data.
1. Overview
1.1 Key messages for users
CFs and RSFs both provide insight into reasons why collisions occur within the STATS19 recording system. Initial analysis suggests that the move from contributory factors to directly recorded road safety factors has led to changes in the factors most commonly assigned to collisions. As a result, users should exercise caution when interpreting apparent trends between data collected under the two systems:
- RSFs replace CFs and are expected to provide more consistent recording.
- From 2025, most police-reported collisions are now recorded using RSFs.
- The move from CFs to RSFs appears to have changed the factors being recorded.
- Users should avoid directly comparing data collected as CFs with data collected directly as RSFs.
- Where possible, analysis of recent data should focus on collisions where RSFs were collected directly.
1.2 Contributory factors and road safety factors
CFs and RSFs provide some insight into why and how road collisions occur. They are designed to give the key actions and failures that led directly to the actual impact to aid investigation of how collisions might be prevented.
When police officers attend the scene of a collision, they are able to select up to 6 factors they believe contributed to the collision. These can be assigned to vehicles, casualties or uninjured pedestrians involved. Please note that this does not assign blame for the collision to any specific road user but gives an indication of which factors the attending officer thought contributed to the collision.
The police officer also indicates whether the factor was ‘very likely’ to have contributed to the collision or only have a ‘possible’ link to the collision. More than one factor can be linked to a single road user, and the same factor can be linked to a series of road users.
Officers do not need to carry out a full investigation of the incident before allocating CFs or RSFs; they usually use professional judgement about what they can see at the scene. Some CFs or RSFs, such as exceeding the speed limit, may not be obvious to the officer and are therefore may be subject to under-reporting.
1.3 History of CF and RSF recording
CFs were added to the STATS19 collection in 2005, which is the first year for which the data are available, and have been consistently recorded from that point until towards the end of 2023. There are a total of 77 CFs from which reporting officers can choose, grouped into 9 sections.
The latest review of the STATS19 collection in 2018 recommended that the CF data collection was replaced with a new collection, known as RSFs. The basic premise of the data remained unchanged, but the number of factors reduced to 37, based on those considered most analytically relevant, and better aligned to the ‘safe system’ pillars which support road safety policy development. It is hoped that the new system will support easier and more consistent recording.
Further details of the reasons for this change are set out in the STATS19 review reports.
As police forces have transitioned to using the specification they are beginning to record data as RSFs and provide this to DfT, though currently some forces are still recording CFs which presents implications for the analysis of the data, as outlined in the section on transition to road safety factors below.
1.4 Why might RSFs give different results?
Road safety factors were deliberately designed to simplify and streamline the previous contributory factor system. As a result, differences between the two systems may arise not only from the mapping of factors but also from how reporting officers interpret and apply the categories in practice. Consequently, changes in the frequency of individual factors may reflect changes in recording behaviour as well as changes in real-world collision characteristics. We have carried out initial exploratory work with Road Safety GB to explore this further.
2. Strengths and limitations
Please note that not all collisions are included in the contributory or road safety factor data. Only collisions where the police attended the scene and reported at least one road safety factor or contributory factor are included. Overall, a total of 68% of collisions reported to the police in 2025 met these criteria.
It is also important to note that collisions can have multiple factors attributed to them. As a result, it is advised that you do not add the results of individual factors in our published tables because collisions could be counted multiple times.
The contributory and road safety factors are different in nature from the remainder of the STATS19 data which is based on the reporting of factual information. CFs and RSFs are largely subjective and depend on the skill and experience of the investigating officer to reconstruct the events which led directly to the collision. This should be kept in mind when interpreting the data.
Guidance to police (STATS20) states that the factors reflect the reporting officer’s opinion at the time of reporting and are not necessarily the result of extensive investigation. Furthermore, it is recognised that subsequent enquiries could lead to the reporting officer changing their opinion, for example because something was not obvious at the time or is revealed following a more detailed investigation (such as the driver using a mobile phone, or a hidden vehicle defect).
Factors should be identified on the basis of evidence rather than guesses about what may have happened. This evidence can come from various sources such as witness statements, vehicle and site inspections. It can be of variable quality, which is the reason for recording the assessment of the reliability of the road safety factors.
We have explored the potential impact on the factors recorded for fatal collisions, with a summary report available containing further details.
3. Available data and statistics
3.1 Published data tables
The road safety factor data are considered sensitive as it may be considered that they imply blame and responsibility for a collision. If the factors can be matched with specific collisions (and specific drivers, vehicles or casualties) they may be sub judice to a prosecution, or may lead to individuals or media reports laying accusations at participants in the collision. As a result, RSF data is not made available at detailed record level or in our data download tool.
Instead, data are published as a series of data tables, which contain number and percentage of collisions and casualties with each factor assigned. In analysing the factor data, it is generally recommended that percentages are used, because, as noted above, factors are not recorded for all collisions.
Since 2024, data has only been presented using the RSF categories (as the CFs can largely be mapped to the new categories), though the previous CF tables, with data to 2023, have been retained for reference purposes.
The transition from CFs to RSFs has raised some challenges in the presentation of the data, which are outlined below and in particular, comparisons between forces recording the new RSFs and those where data are still captured as CFs should be made carefully, as the change in collection system appears to have led to a break in the time series for some factors. For this reason, a number of data tables (RAS0704 to RAS0706) remain withdrawn while further analysis is carried out.
3.2 Data access and confidentiality
If more detailed data are required than are presented in our spreadsheet tables, a data extract can be requested from the road safety team, subject to completion of an end user agreement setting out the use of the data and how the sensitive data will be protected. An application for sensitive data can be completed and sent to the team via roadacc.stats@dft.gov.uk.
The department has previously published research looking at appropriate release practices for contributory factors as carried out by the Methodology Advisory Unit at the Office for National Statistics. This outlined the main risks for identifying contributory factors with individuals and what action would be required to take to minimise this risk. In practice, the main change this brought about was allowing the release of a table containing the total number of contributory factors by local authority. This table was published for the first time in 2013 and has previously been published as table RAS0706, though updates to this table have been paused during the switch from CFs to RSFs.
4. Transition to road safety factors
As noted above, following the last STATS19 review, CFs are being replaced by RSFs. However, as the adoption of the new STATS19 specification is happening at different times in different police forces, for the years between 2023 and 2026 (at least) there is likely to be a mix of both RSF and CF data. This section illustrates some of the challenges this presents and outlines the department’s approach to addressing these, based on the available data.
4.1 Mapping of contributory factors
It is possible to map from the CFs to RSFs, so that data recorded as CFs can be analysed using the RSF categorisation. This has been done in our initial analysis which includes a spreadsheet mapping between CFs and RSFs. While some factors map directly across between the two systems there are some factors that cannot be mapped directly from CFs to RSFs or where multiple CFs map to a single RSF. In the department’s published materials, the RSF categories will be presented by default, though the CF data can be made available on request.
4.2 Timeline in adoption of RSF recording
The first directly recorded RSFs relate to data from November 2023, for some forces using the CRASH (Collision Reporting and Sharing) system. Most police forces have provided their 2025 data with RSFs recorded directly rather than as CFs which have then been converted to RSFs. The list of police forces by specification can be found in table 7 in the background information section. The majority of these are forces using the CRASH system.
Overall, for 2025 data, it is estimated 75% of collisions with at least one CF or RSF recorded were collected directly as RSFs. Based on force plans regarding the new STATS19 specification, for 2026, we anticipate that most, but not all, data will be RSFs.
Chart 1: Proportion of collisions with CFs or RSFs recorded by data collection method
| Year | Collected as CFs | Collected as RSFs | Total |
|---|---|---|---|
| 2022 and before | 100% | 0% | 100% |
| 2023 | 97% | 3% | 100% |
| 2024 | 69% | 31% | 100% |
| 2025 | 25% | 75% | 100% |
5. Impact of transition to RSFs
This section represents an initial analysis, based on data available as at July 2026 and the best information we have from police forces on how data were captured. Further work is planned to better understand the impact of the move from CFs to RSFs, and this guidance will be updated in due course as our understanding improves.
The mapping of CFs to RSFs was derived prior to the collection of any directly recorded RSF data and was based on an understanding of how the systems should relate to each other rather than any analysis of how the police would collect data in the RSF system. The analysis presented below aims to explore if the change in system has resulted in a change in what factors are being reported.
In 2025, approximately 75% of collisions have data that has been directly recorded as RSFs. Now that this is a substantial majority of collisions, the effects of the changes in reporting practices can be better seen and analysed.
5.1 Number of factors recorded
On average, in 2025, 2.5 RSFs were reported per collision, which compares with around 2.0 RSFs converted from CFs per collision, for collisions collected using the CF system. The STATS19 review recommended that each collision have 3 to 6 factors assigned, and it appears that 56% of collisions with RSFs in 2025 had 3 or more factors (compared with approximately 66% in 2024).
5.2 Comparison of data by RSF section
RSFs are grouped into different categories, broadly aligned to the safe system pillars.
Chart 2 shows the proportion of collisions with at least one factor, split by RSF section, for:
- 2022 (the last year for which all forces consistently recorded CFs), converted from CFs
- the 25% of collisions with data collected as CFs and converted to RSFs in 2025
- the 75% of collisions with data directly collected as RSFs in 2025
The chart shows that although not all forces are now recording data as CFs, the pattern of which factors are being collected remains broadly similar to previous years when all data was collected as CFs and then converted to RSFs. However, when the data are directly collected as RSFs, there are some notable differences.
Chart 2: Proportion of collisions with road safety factors, by RSF section, 2022 and 2025 comparing converted and directly recorded RSF data
| Road safety factor section | % with factor 2022 (all recorded as CFs) | % with factor 2025 recorded as CFs | % with factor 2025 recorded as RSFs |
|---|---|---|---|
| Behaviour or inexperience | 64 | 62 | 74 |
| Speed | 40 | 44 | 34 |
| Distraction or impairment | 19 | 21 | 29 |
| Road | 18 | 16 | 19 |
| Non-motorised road users | 7 | 7 | 12 |
| Vehicles | 4 | 4 | 6 |
| Not coded | 3 | 1 | 0 |
Table 1 shows specifically how the proportion of collisions in 2025 that were assigned to each road safety factor section under the two different collection systems, as well as the relative change in these proportions.
This shows that there has been an increase in the number of collisions assigned a factor from each section with the exception of the speed section. In part this is likely to be driven by the increase in the number of factors being assigned. However, the fact that this increase is not evenly distributed across the different RSF categories indicates that the move to directly collecting RSF data results in a change in which factors are being recorded.
The biggest proportional increases are for the factors in the “non-motorised road users” section, and while smaller in proportional terms the increase in the “behaviour or inexperience” section from 62% of converted collisions to 74% of directly recorded collisions is notable for being a large absolute change.
Table 1: Change in the proportion of collisions with different road safety factor sections assigned, 2025
| Road safety factor section | Proportion of collisions converted from CFs | Proportion of collisions directly collected as RSFs | Relative change in proportion |
|---|---|---|---|
| Behaviour or inexperience | 62 | 74 | 1.19 |
| Speed | 44 | 34 | 0.77 |
| Distraction or impairment | 21 | 29 | 1.38 |
| Road | 16 | 19 | 1.19 |
| Non-motorised road users | 7 | 12 | 1.71 |
| Vehicles | 4 | 6 | 1.50 |
5.3 Comparison of data for individual factors
A similar analysis can be done looking at the recording of individual factors.
The top 10 most commonly recorded factors for data collected as CFs and converted to RSFs, and directly recorded as RSFs, are shown in Chart 3. This shows a mixture of patterns – in some cases, the proportion of collisions are broadly similar (for example, travelling too fast for conditions), in some cases there is a greater prevalence of a factor when recorded directly as an RSF (including exceeding speed limit) and in others the proportion of collisions is lower when RSFs are directly coded (such as driver being aggressive).
Chart 3: Top 10 most commonly assigned RSFs for collisions with data directly recorded as RSFs, compared with data collected as CFs and converted to RSFs, Great Britain 2025
| Road safety factor | % with factor – converted from CFs | % with factor – directly recorded as RSFs |
|---|---|---|
| Ineffective observation by either the driver or rider or pedestrian | 47 | 52 |
| Driver or rider overshot junction or poor turn or manoeuvre | 12 | 23 |
| Driver or rider travelling too fast for conditions (including loss of control or swerving) | 16 | 15 |
| Distraction to driver or rider from inside or outside or on vehicle | 6 | 13 |
| Driver or rider exceeding speed limit | 8 | 13 |
| Driver or rider being aggressive or dangerous or reckless | 29 | 13 |
| Driver or rider passing too close to another road user or pedestrian | 1 | 9 |
| Driver or rider inexperienced or learner | 7 | 9 |
| Road surface was slippery due to weather | 5 | 8 |
| Driver or rider illegal turn or direction of travel or failed to comply with traffic sign or signal | 6 | 8 |
Table 2 shows the 10 RSFs that have had the biggest absolute change in how often they are collected in collisions where RSFs are directly recorded. With the exception of “driver or rider being aggressive or dangerous or reckless”, these are all increases relative to how frequently they are assigned in collisions where data was originally collected as CFs.
While overall there has been a decrease in the overall number of collisions assigned a factor in the speed section, this overall decrease can mask the changes at a factor level where there is a notable increase in the number of collisions assigned “driver or rider exceeding speed limit” that is obscured as a sectional level by the larger decrease in the number of collisions assigned “driver or rider being aggressive or dangerous or reckless” which is also in the speed section.
Table 2: Top 10 changes in the proportion of collisions with different road safety factors assigned, ordered by absolute percentage change, 2025
| Road safety factor | % with factor – converted from CFs | % with factor – directly recorded as RSFs | Change in proportion (percentage points) |
|---|---|---|---|
| Driver or rider being aggressive or dangerous or reckless | 29 | 13 | -16 |
| Driver or rider overshot junction or poor turn or manoeuvre | 12 | 23 | 11 |
| Driver or rider passing too close to another road user or pedestrian | 1 | 9 | 8 |
| Distraction to driver or rider from inside or outside or on vehicle | 6 | 13 | 7 |
| Driver or rider exceeding speed limit | 8 | 13 | 5 |
| Ineffective observation by either the driver or rider or pedestrian | 47 | 52 | 4 |
| Road surface was slippery due to weather | 5 | 8 | 3 |
| Sudden braking or braking in a way unsuitable for conditions | 4 | 7 | 3 |
| Pedestrian or cyclist or equestrian hard to see | 1 | 4 | 3 |
| Incorrect use of crossing facility by person crossing the road | 1 | 3 | 3 |
Further analysis shows that for the 10 factors highlighted in table 2 there is relatively little change in what proportion of collisions were assigned these factors for collisions that were collected as CFs and converted to RSFs from 2022 to 2025. This indicates that the changes shown in table 2 are likely a result of the change from collecting CFs to directly collecting RSF data.
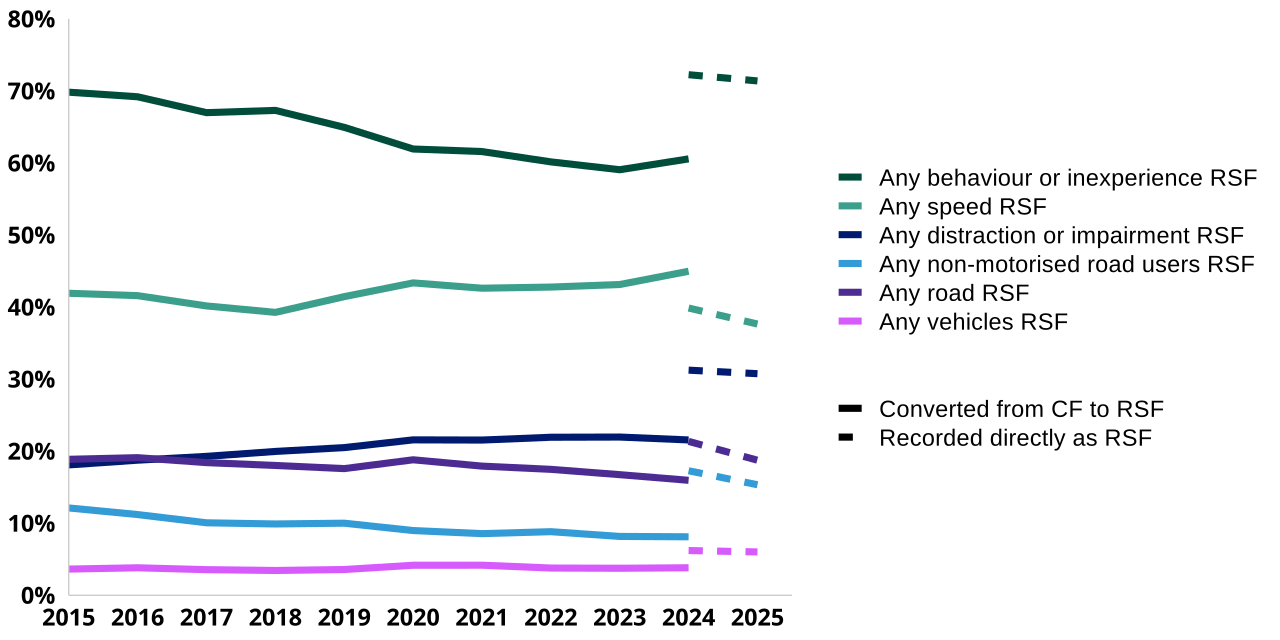
This is illustrated in Chart 4 which shows that the levels of recording for the top 4 RSF sections in the directly recorded data is substantially different from the background trend in data converted from CFs over the last 10 years.
Chart 4: Percentage of collisions assigned a road safety factor, by RSF section and collection methodology, Great Britain, 2015 to 2025
6. Guidance on analysing CFs and RSFs
The results shown in the previous section demonstrate that there appears to be a step change in the factors that are being recorded by police forces as a result of the move to directly collecting RSFs.
6.1 Suggested approach
While users are welcome to analyse the published data as they wish, based on the above analysis, we recommended that:
- data that has been collected as CFs and converted to RSFs is not directly compared to data that has been collected directly as RSFs to avoid implying trends in the data that do not exist
- any time-series analysis should be based on the proportion of collisions assigned a given factor rather than the number of collisions as the reduced scope of CF collection will mean that the number of collisions assigned any given factor is likely to have gone down, as 75% of the data is now being captured as RSFs
- where possible, any analysis on 2025 data should be based on the directly collected RSF data, as this is likely to be more representative of the factors that are being recorded by police forces
We will present analyses in our reports and statistics on this basis, now that data recorded as directly as RSFs has become a significant majority of the data.
Analysis of directly collected RSF data should be treated with caution until more work is done to fully understand the impact of the change in collection system. While there are some clear differences, it is hard to draw firm conclusions, and further work is needed to better understand the behaviour of reporting officers when presented with a different, shorter list of factors. The nature of the system used – whether desktop or mobile – is also likely to influence patterns shown.
6.2 Changes to published materials
As a result of the changes to the data collection and due to most collisions having RSFs as opposed to CFs, we have made the following changes to our published outputs, which include:
-
where reports and factsheets contain national level CF or RSF data this is only based on the portion of collisions where data was collected directly as RSFs, consequently any collision numbers have been changed to percentages
-
the format of tables RAS0701, RAS0702, and RAS0703 continues to separate out data collected as CFs and then converted to RSFs from data directly collected as RSFs
-
tables RAS0705 and RAS0706 remain withdrawn as it is not possible to make comparisons between areas where data has been converted as CFs and where it has been directly collected as RSFs
-
related statistical outputs, including the fatal 4 factsheet, will be reviewed as the transition to RSFs progresses
7. Future developments
We expect the remaining police forces to transition to directly recording RSFs during 2026 and 2027. We will continue to monitor the effect that this has on the statistics and will update this guidance once more data has been collected.
Once more data has been collected, we will also explore if we are able to reinstate the tables with local authority breakdowns that have been dropped and what can be done to create a long-term comparable time-series of road safety factors.
This will involve working with police forces and other road safety stakeholders to explore where the step change in the data has come from and what can be done to account for it our analysis. This guidance will be updated as and when further information is available.
8. Background information: CF and RSF coverage
CF and RSF reporting can vary from force to force depending on operational practices, experience of road traffic collisions, systems used and requirements of the force.
Tables 3 to 7 give more insight about underlying reporting practices. Figures for collisions collected with RSFs for 2023 should be treated with caution, as they can be based on a relatively small number of collisions
Table 3a: Percentage of reported collisions collected in the CF specification included in the contributory factor analysis, by severity
| Severity | 2016 | 2017 | 2018 | 2019 | 2020 | 2021 | 2022 | 2023 | 2024 | 2025 |
|---|---|---|---|---|---|---|---|---|---|---|
| Fatal collisions | 85 | 87 | 87 | 86 | 84 | 86 | 90 | 95 | 91 | 86 |
| Fatal or serious collisions | 82 | 82 | 81 | 80 | 78 | 80 | 82 | 83 | 80 | 77 |
| All collisions | 73 | 72 | 69 | 67 | 66 | 66 | 67 | 66 | 65 | 63 |
Table 3b: Percentage of reported collisions collected in the RSF specification included in the road safety factor analysis, by severity
| Severity | 2023 | 2024 | 2025 |
|---|---|---|---|
| Fatal collisions | 97 | 99 | 99 |
| Fatal or serious collisions | 81 | 86 | 84 |
| All collisions | 61 | 70 | 70 |
Table 4a: Percentage of reported collisions collected in the CF specification included in the contributory factor analysis, by road class
| Road class | 2016 | 2017 | 2018 | 2019 | 2020 | 2021 | 2022 | 2023 | 2024 | 2025 |
|---|---|---|---|---|---|---|---|---|---|---|
| Motorway | 80 | 81 | 78 | 76 | 75 | 74 | 77 | 77 | 75 | 74 |
| A Roads | 77 | 75 | 73 | 69 | 68 | 68 | 69 | 69 | 67 | 65 |
| B Roads | 74 | 73 | 71 | 69 | 67 | 68 | 69 | 69 | 66 | 64 |
| Other roads | 69 | 67 | 64 | 63 | 62 | 63 | 62 | 62 | 61 | 59 |
Table 4b: Percentage of reported collisions collected in the RSF specification included in the road safety factor analysis, by road class
| Road class | 2023 | 2024 | 2025 |
|---|---|---|---|
| Motorway | 70 | 76 | 77 |
| A Roads | 65 | 74 | 72 |
| B Roads | 63 | 72 | 72 |
| Other roads | 55 | 66 | 66 |
Table 5a: Percentage of reported collisions involving each vehicle type collected in the CF specification directly allocated a contributory factor
| Vehicle type | 2016 | 2017 | 2018 | 2019 | 2020 | 2021 | 2022 | 2023 | 2024 | 2025 |
|---|---|---|---|---|---|---|---|---|---|---|
| Pedal cycle | 62 | 58 | 55 | 52 | 53 | 52 | 50 | 49 | 49 | 46 |
| Motorcycle | 82 | 81 | 80 | 77 | 72 | 71 | 69 | 66 | 66 | 72 |
| Car | 73 | 72 | 69 | 67 | 65 | 67 | 67 | 66 | 65 | 63 |
| Bus or coach | 67 | 69 | 66 | 64 | 65 | 66 | 69 | 65 | 73 | 62 |
| Light goods vehicle | 76 | 75 | 73 | 69 | 67 | 67 | 68 | 69 | 67 | 65 |
| Heavy goods vehicle | 79 | 80 | 77 | 76 | 75 | 76 | 78 | 79 | 72 | 68 |
| Other | 63 | 62 | 59 | 58 | 62 | 58 | 58 | 58 | 56 | 55 |
Table 5b: Percentage of reported collisions involving each vehicle type collected in the RSF specification directly allocated a road safety factor
| Vehicle type | 2023 | 2024 | 2025 |
|---|---|---|---|
| Pedal cycle | 37 | 50 | 50 |
| Motorcycle | 71 | 81 | 78 |
| Car | 61 | 70 | 70 |
| Bus or coach | 47 | 57 | 69 |
| Light goods vehicle | 62 | 71 | 73 |
| Heavy goods vehicle | 68 | 81 | 81 |
| Other | 55 | 57 | 62 |
Table 6a: Percentage of reported collisions collected in the CF specification included in the contributory factor analysis, by police force Note that for some forces, there are a low number of records in a given year (under 100) which may affect the figures shown for that year; these cases are shown as [x] in the table.
| Police force | 2016 | 2017 | 2018 | 2019 | 2020 | 2021 | 2022 | 2023 | 2024 | 2025 |
|---|---|---|---|---|---|---|---|---|---|---|
| Metropolitan Police | 82 | 77 | 71 | 65 | 61 | 60 | 60 | 55 | 59 | 46 |
| Cumbria | 63 | 62 | 58 | 72 | 75 | 67 | 68 | 70 | [x] | [x] |
| Lancashire | 100 | 100 | 100 | 76 | 75 | 72 | 74 | 73 | 73 | 75 |
| Merseyside | 81 | 76 | 70 | 70 | 68 | 66 | 64 | 65 | 67 | 65 |
| Greater Manchester | 60 | 60 | 54 | 48 | 49 | 35 | 32 | 47 | 17 | [x] |
| Cheshire | 70 | 75 | 75 | 74 | 75 | 70 | 66 | 69 | 69 | [x] |
| Northumbria | 58 | 46 | 34 | 28 | 25 | 30 | 29 | 38 | [x] | [x] |
| Durham | 43 | 27 | 54 | 19 | 18 | 36 | 51 | 58 | [x] | [x] |
| North Yorkshire | 82 | 81 | 80 | 80 | 81 | 74 | 80 | 82 | 81 | 77 |
| West Yorkshire | 69 | 69 | 69 | 69 | 68 | 73 | 76 | 73 | 69 | 70 |
| South Yorkshire | 74 | 70 | 73 | 70 | 74 | 72 | 72 | 76 | 69 | 67 |
| Humberside | 60 | 57 | 63 | 62 | 64 | 64 | 62 | 61 | 62 | 47 |
| Cleveland | 75 | 80 | 77 | 76 | 73 | 76 | 76 | 68 | 78 | [x] |
| West Midlands | 51 | 45 | 40 | 40 | 51 | 53 | 49 | 46 | 39 | [x] |
| Staffordshire | 36 | 36 | 34 | 32 | 41 | 54 | 54 | 64 | 59 | [x] |
| West Mercia | 78 | 78 | 78 | 78 | 76 | 79 | 76 | 78 | 74 | 92 |
| Warwickshire | 77 | 78 | 80 | 75 | 81 | 81 | 79 | 76 | 76 | 78 |
| Derbyshire | 73 | 70 | 65 | 64 | 75 | 68 | 69 | 65 | 72 | [x] |
| Nottinghamshire | 74 | 74 | 71 | 72 | 73 | 74 | 57 | 60 | [x] | [x] |
| Lincolnshire | 80 | 81 | 79 | 80 | 84 | 84 | 87 | 81 | [x] | [x] |
| Leicestershire | 73 | 70 | 70 | 73 | 79 | 87 | 94 | 78 | [x] | [x] |
| Northamptonshire | 52 | 55 | 64 | 70 | 76 | 78 | 76 | 79 | [x] | [x] |
| Cambridgeshire | 71 | 69 | 68 | 66 | 56 | 66 | 57 | 58 | [x] | [x] |
| Norfolk | 61 | 76 | 78 | 71 | 45 | 73 | 70 | 72 | 73 | [x] |
| Suffolk | 60 | 73 | 74 | 72 | 46 | 71 | 68 | 70 | [x] | [x] |
| Bedfordshire | 71 | 69 | 70 | 73 | 65 | 68 | 59 | 54 | [x] | [x] |
| Hertfordshire | 70 | 67 | 75 | 75 | 68 | 69 | 61 | 55 | [x] | [x] |
| Essex | 36 | 36 | 32 | 65 | 60 | 57 | 62 | 72 | 96 | [x] |
| Thames Valley | 81 | 84 | 74 | 68 | 68 | 67 | 66 | 61 | 55 | 51 |
| Hampshire | 83 | 81 | 80 | 77 | 77 | 74 | 77 | 78 | 76 | 76 |
| Surrey | 81 | 85 | 83 | 76 | 74 | 73 | 74 | 71 | 74 | 78 |
| Kent | 64 | 54 | 51 | 67 | 71 | 71 | 72 | 73 | 32 | [x] |
| Sussex | 75 | 74 | 73 | 73 | 75 | 73 | 74 | 72 | 72 | 87 |
| City of London | 76 | 71 | 73 | 66 | [x] | [x] | 69 | 60 | 63 | [x] |
| Devon and Cornwall | 77 | 76 | 80 | 81 | 80 | 80 | 79 | 72 | 76 | 78 |
| Avon and Somerset | 67 | 69 | 59 | 58 | 52 | 54 | 58 | 66 | 69 | [x] |
| Gloucestershire | 77 | 71 | 58 | 69 | 73 | 76 | 81 | 82 | 81 | 83 |
| Wiltshire | 86 | 87 | 88 | 88 | 84 | 84 | 82 | 84 | 86 | 86 |
| Dorset | 86 | 80 | 80 | 84 | 77 | 77 | 76 | 73 | 73 | 75 |
| North Wales | 82 | 83 | 83 | 84 | 83 | 83 | 83 | 81 | 81 | 82 |
| Gwent | 82 | 89 | 86 | 88 | 90 | 91 | 84 | 84 | 84 | 81 |
| South Wales | 97 | 97 | 95 | 96 | 98 | 94 | 96 | 94 | 93 | 90 |
| Dyfed-Powys | 81 | 81 | 80 | 81 | 80 | 76 | 86 | 84 | 80 | [x] |
| Police Scotland | 85 | 85 | 86 | 69 | 61 | 76 | 82 | 87 | 85 | 81 |
Table 6b: Percentage of reported collisions collected in the RSF specification included in the road safety factor analysis, by police force Note that for some forces, there are a low number of records in a given year (under 100) which may affect the figures shown for that year; these cases are shown as [x] in the table.
| Police force | 2023 | 2024 | 2025 |
|---|---|---|---|
| Metropolitan Police | [x] | [x] | 62 |
| Cumbria | [x] | 82 | 85 |
| Lancashire | [x] | [x] | 83 |
| Greater Manchester | 54 | 70 | 57 |
| Cheshire | [x] | [x] | 70 |
| Northumbria | 44 | 44 | 46 |
| Durham | [x] | 57 | 55 |
| West Yorkshire | [x] | 95 | 84 |
| Humberside | [x] | [x] | 69 |
| Cleveland | [x] | 64 | 66 |
| West Midlands | [x] | 54 | 66 |
| Staffordshire | [x] | 74 | 73 |
| West Mercia | [x] | 85 | 61 |
| Derbyshire | [x] | 66 | 71 |
| Nottinghamshire | 68 | 63 | 63 |
| Leicestershire | [x] | 76 | 75 |
| Northamptonshire | [x] | 79 | 76 |
| Cambridgeshire | [x] | 68 | 65 |
| Norfolk | [x] | 80 | 81 |
| Suffolk | [x] | 79 | 77 |
| Bedfordshire | [x] | 66 | 65 |
| Hertfordshire | [x] | 69 | 65 |
| Essex | 51 | 66 | 69 |
| Thames Valley | [x] | [x] | 67 |
| Hampshire | [x] | [x] | 77 |
| Surrey | [x] | [x] | 74 |
| Kent | [x] | 93 | 95 |
| Sussex | [x] | 51 | 76 |
| Devon and Cornwall | [x] | 73 | 81 |
| Avon and Somerset | [x] | [x] | 69 |
| Gloucestershire | [x] | [x] | 89 |
| Wiltshire | [x] | [x] | 87 |
| Dorset | [x] | [x] | 74 |
| Dyfed-Powys | [x] | [x] | 86 |
| Police Scotland | 83 | 85 | 87 |
Table 7: Status of police force RSF data collection in the latest year
| Police Force | 2025 data status |
|---|---|
| Metropolitan Police | Some data collected as RSFs |
| Cumbria | All data collected as RSFs |
| Lancashire | Some data collected as RSFs |
| Merseyside | All data collected as CFs |
| Greater Manchester | All data collected as RSFs |
| Cheshire | All data collected as RSFs |
| Northumbria | All data collected as RSFs |
| Durham | All data collected as RSFs |
| North Yorkshire | All data collected as CFs |
| West Yorkshire | Some data collected as RSFs |
| South Yorkshire | All data collected as CFs |
| Humberside | Some data collected as RSFs |
| Cleveland | All data collected as RSFs |
| West Midlands | All data collected as RSFs |
| Staffordshire | All data collected as RSFs |
| West Mercia | Some data collected as RSFs |
| Warwickshire | All data collected as CFs |
| Derbyshire | All data collected as RSFs |
| Nottinghamshire | All data collected as RSFs |
| Lincolnshire | No consistent data recorded |
| Leicestershire | All data collected as RSFs |
| Northamptonshire | All data collected as RSFs |
| Cambridgeshire | All data collected as RSFs |
| Norfolk | All data collected as RSFs |
| Suffolk | All data collected as RSFs |
| Bedfordshire | All data collected as RSFs |
| Hertfordshire | All data collected as RSFs |
| Essex | All data collected as RSFs |
| Thames Valley | Some data collected as RSFs |
| Hampshire | Some data collected as RSFs |
| Surrey | Some data collected as RSFs |
| Kent | All data collected as RSFs |
| Sussex | Some data collected as RSFs |
| City of London | Some data collected as RSFs |
| Devon and Cornwall | Some data collected as RSFs |
| Avon and Somerset | All data collected as RSFs |
| Gloucestershire | Some data collected as RSFs |
| Wiltshire | Some data collected as RSFs |
| Dorset | Some data collected as RSFs |
| North Wales | All data collected as CFs |
| Gwent | All data collected as CFs |
| South Wales | Some data collected as RSFs |
| Dyfed-Powys | All data collected as RSFs |
| Police Scotland | All data collected as RSFs |
9. Instructions for printing and saving
Depending on which browser you use and the type of device you use (such as a mobile or laptop) these instructions may vary.
Tablets and mobile devices normally have the option to “find in text” and “print or save” in their sharing or quick options menu of their browser, but this will vary by device model.
10. How to search
Select Ctrl and F on a Windows laptop or Command and F on a Mac
This will open a search box in the top right-hand corner of the page. Type the word you are looking for in the search bar and press enter.
Your browser will highlight the word, usually in yellow, wherever it appears on the page. Press enter to move to the next place it appears.
11. Contact details
Road safety statistics
Email roadacc.stats@dft.gov.uk
To hear more about DfT statistical publications as they are released, follow us on X (formerly known as Twitter) at DfTstats.