Civil Service Diversity and Inclusion Dashboard
Updated 10 May 2022

© Crown copyright 2022
This publication is licensed under the terms of the Open Government Licence v3.0 except where otherwise stated. To view this licence, visit nationalarchives.gov.uk/doc/open-government-licence/version/3 or write to the Information Policy Team, The National Archives, Kew, London TW9 4DU, or email: psi@nationalarchives.gov.uk.
Where we have identified any third party copyright information you will need to obtain permission from the copyright holders concerned.
This publication is available at https://www.gov.uk/government/publications/civil-service-diversity-inclusion-dashboard/civil-service-diversity-and-inclusion-dashboard
1. Representation: ensuring the Civil Service reflects the diversity of the UK
The Civil Service is at its best when it reflects the diversity of the country as a whole and is able to understand what the public needs. When people from diverse backgrounds are involved in creating the public services we all rely on, we get better services that work for everyone. For these reasons, the Civil Service is committed to reflecting the country that we serve, and is taking targeted action to tackle underrepresentation, especially in the Senior Civil Service.
Our workforce data shows that the Civil Service as a whole is broadly representative of the UK’s working population, but there is more to be done to ensure that this diversity is reflected at all levels across departments and professions.
1.1 Representation of different groups in the Civil Service
Latest figures show that 54.2% of civil servants are women, 14.3% are ethnic minorities and 13.6% are disabled. The representation of ethnic minority staff is in line with the wider working population (13.6% of the UK’s working population were from ethnic minorities in July 2021) whilst disabled staff are still slightly underrepresented (14.7% of the UK’s working population were disabled as at March 2021).
Civil servants who are disabled, from an ethnic minority background or a woman are more likely to be in more junior roles, but the proportion in more senior roles has been increasing since 2010. In Grades 6 and 7 - the feeder grades for the Senior Civil Service - the proportion of disabled staff has risen from 4.9% to 9.7% since 2010, and the proportion of staff who are ethnic minorities has gone from 6.9% to 12.1%.
The overall representation of women in the Civil Service has remained above 50% since 2010. For grades HEO and above, the proportion of women has increased from 2010 and is getting closer to achieving gender parity.
1.2 Gender balance
Representation of women by grade, 2010-2021
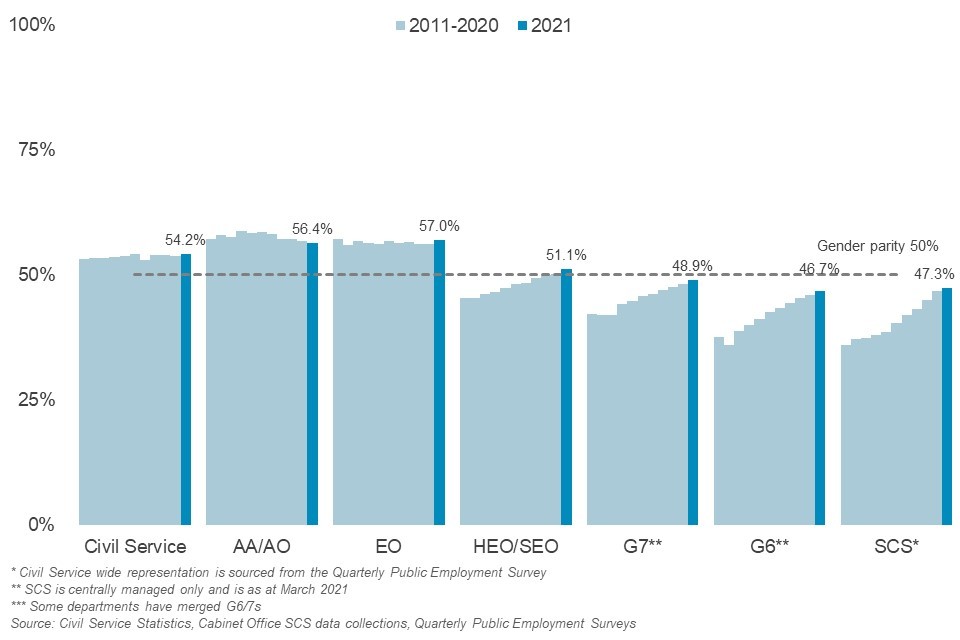
Bar chart to show gender balance by grade 2011-2021
Overall, 54.2% of the Civil Service are women in 2021. This varies by grade from 47.3% in the Senior Civil Service (SCS) to 57.0% at EO level. The overall percentage has remained fairly stable since 2010 but for the SCS, the percentage of women has increased each year.
1.3 Ethnic minorities
Representation of ethnic minorities by grade, 2010-2021
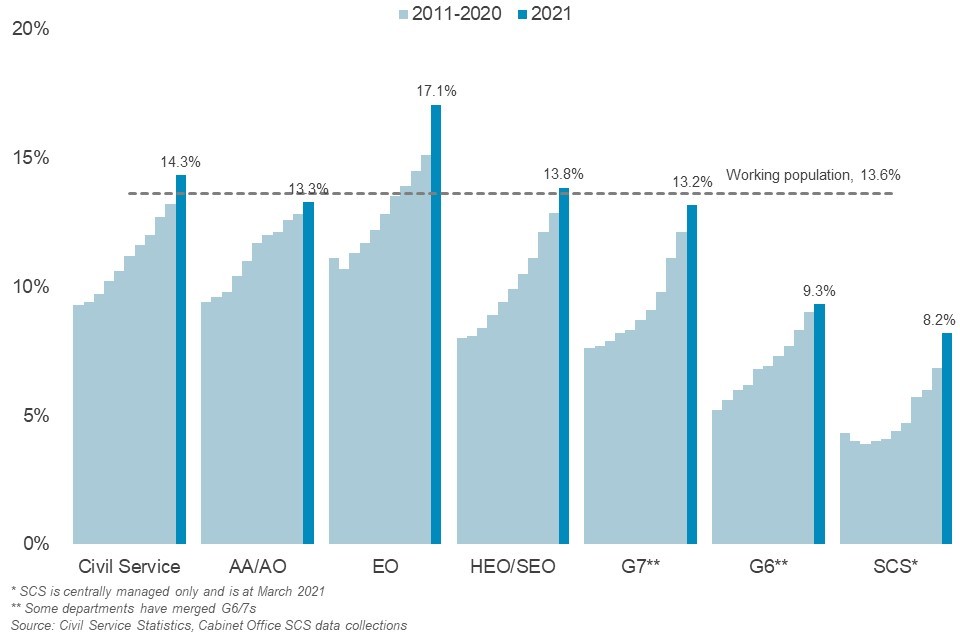
Bar chart to show ethnicity by grade 2011-2021
Overall, 14.3% of civil servants are from an ethnic minority background in 2021. By grade this varies from 8.2% in the SCS to 17.1% at EO level. Both the overall percentage and the percentage in every grade has increased since 2010.
Representation of ethnic groups in the Civil Service, excluding the White ethnic group, 2015 - 2021
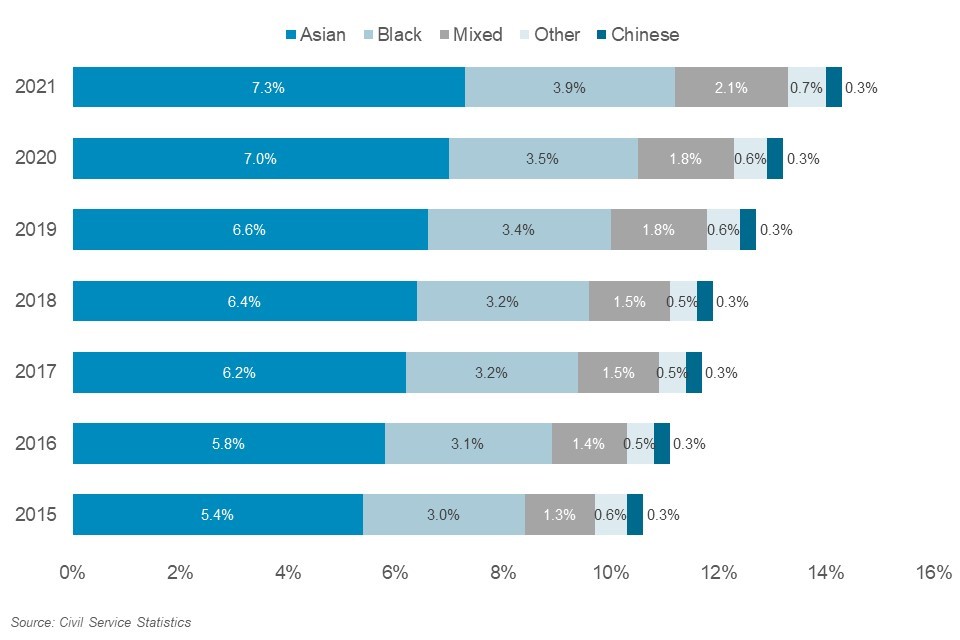
Stacked bar chart to show ethnicity since 2015
Of those who reported their ethnicity, 7.3% are Asian, 3.9% are Black, 2.1% are mixed, 0.6% are Other, and 0.3% are Chinese as at March 2021.
As with the UK’s population as a whole, the Civil Service has a higher proportion of ethnic minorities in London (35.3%) than elsewhere (8.8% including overseas). Where in the country civil servants work is one factor behind the variation in ethnic diversity by department.
1.4 Disability
Representation of disabled staff by grade, 2010-2021
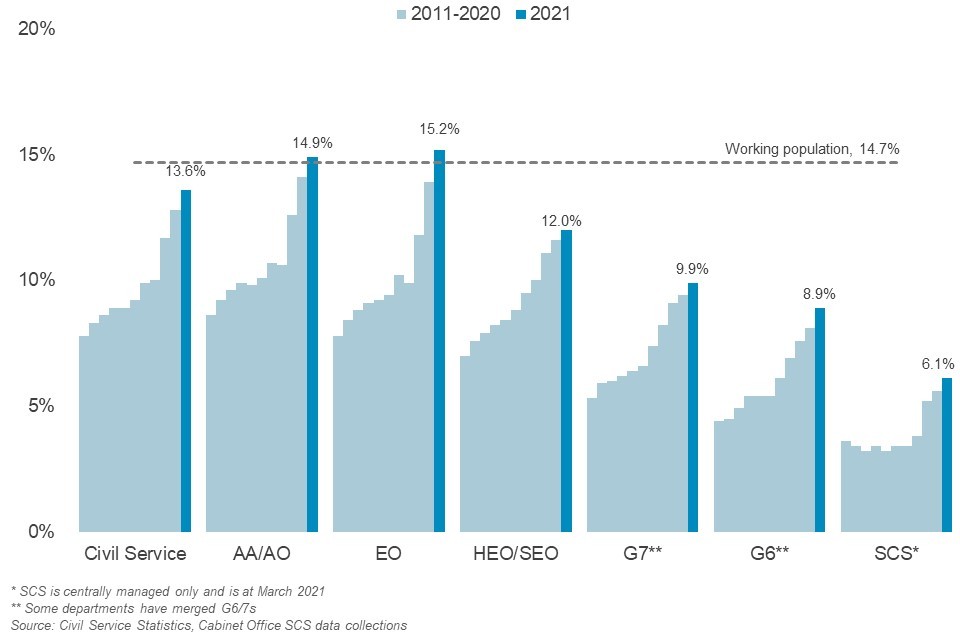
Bar chart to show disabled % by grade 2011-2021
Overall, 13.6% of civil servants have recorded that they have a disability in 2021. By grade this varies from 6.1% in the SCS to 15.2% at EO level. Both the overall percentage and the percentage in every grade has increased since 2010.
1.5 Sexual orientation
In recent years we have been asking civil servants to tell us about their sexual orientation; in 2021, 69% of civil servants did so. Of those who recorded their sexual orientation, 94.4% say they are heterosexual, 3.3% say that they are gay or lesbian, 1.7% say they are bisexual and 0.6% recorded their sexual orientation as ‘other’.
When broken down by gender, 4.6% of men with known sexual orientation are gay, 1.3% are bisexual and 0.6% record their sexual orientation as ‘other’ as at March 2021. This compares to 2.3% of women with known sexual orientation who are gay/lesbian, 2.0% who are bisexual and 0.6% who record their sexual orientation as ‘other’ as at March 2021.
Sexual orientation in the Civil Service, excluding heterosexual, by gender 2021
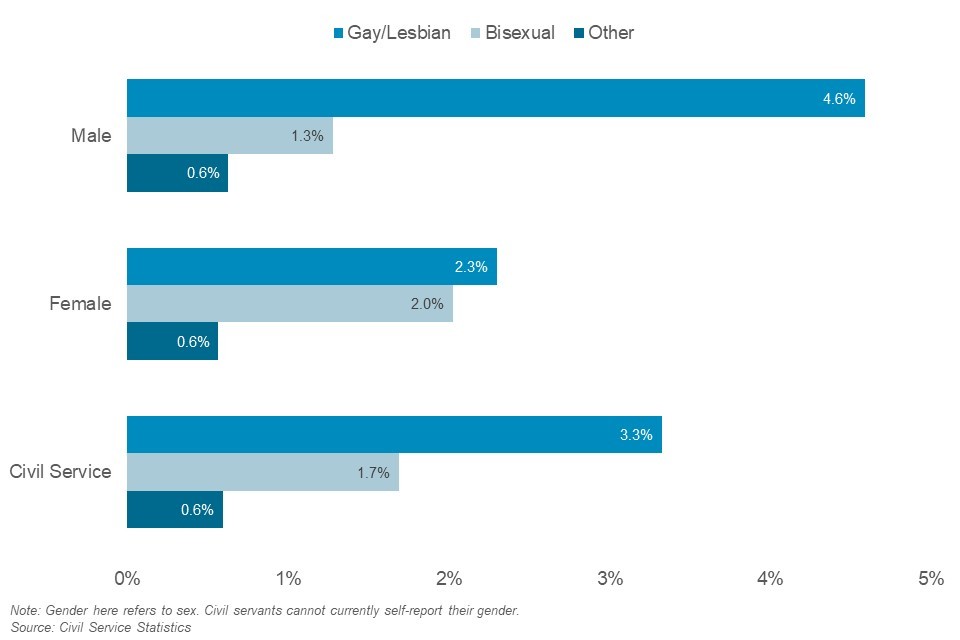
Horizontal bar to show sexual orientation by gender 2021
There is some variation in the representation of these groups by grade but currently we cannot discern a clear pattern. As we achieve higher rates of recording of sexual orientation, this may change.
Representation of Lesbian, Gay, Bisexual and ‘Other’ (LGBO)** staff by grade, 2015-2021

Bar chart to show sexual orientation by grade 2011-2021
Overall, 5.6% of civil servants are Lesbian, Gay, Bisexual or recorded their sexual orientation as ‘Other’, in 2021. By grade this varies from 5.4% at grade AA/AO level to 6.2% at Grade 6/7. The overall percentage has increased over the last three years.
1.6 Religion and belief
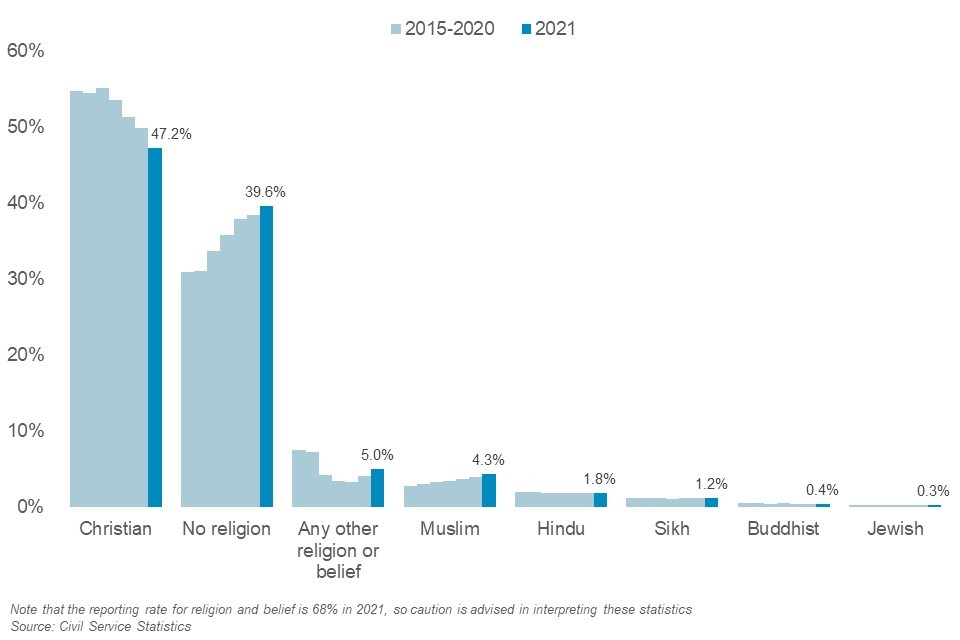
Although in recent years civil servants have been asked to report their religion, belief or non-belief, only 68% of civil servants have done so in 2021. Of those who have, 47.2% were Christian and 39.6% reported they had no religion or belief. The most common reported religion or belief after Christianity was Islam (Muslim) at 4.3%.
Representation of staff by religion or belief, 2015 - 2021
Bar chart showing religion 2011-2021
Of those who recorded their religion, belief, or non-belief; 47.2% are Christian and 39.6% have no religion or belief as at March 2021. Note that the recording rate for religion and belief is low (68% in 2021).
1.7 Age
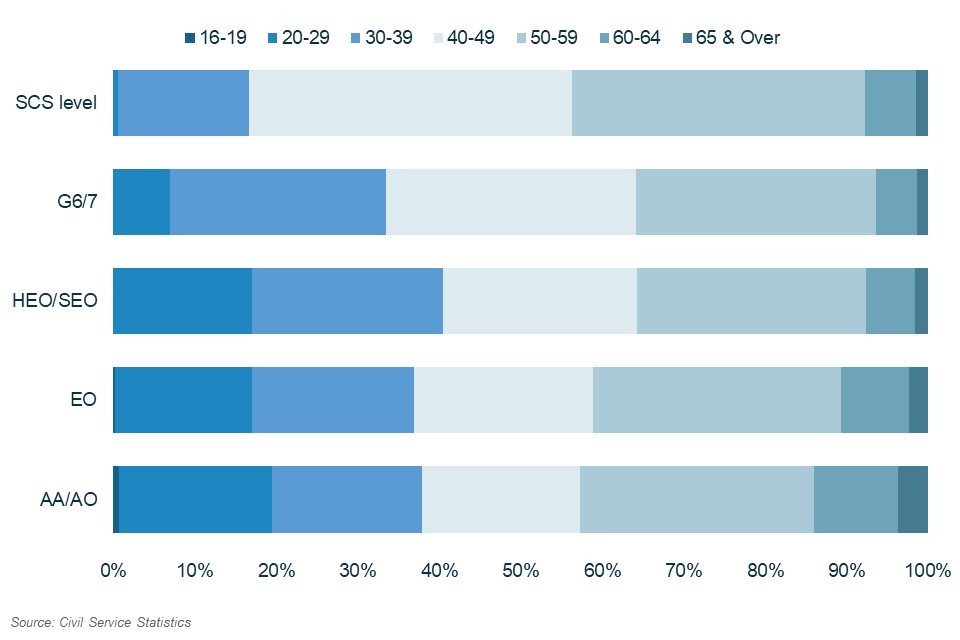
The median age of civil servants is 45. Overall, the median age has decreased from 46 in 2020, but has still increased from age 44 in 2010. There is little variation in median age by grade. The median age is highest at SCS level at 48 at SCS level and lowest at HEO/SEO level at 43. The proportion of SCS level staff under the age of 40 is 16.6%, which is lower than that in Grades 6 and 7, where 33.5% of staff are under 40.
Proportion of staff by age and grade, 2021
Stacked bar chart showing age by grade 2021
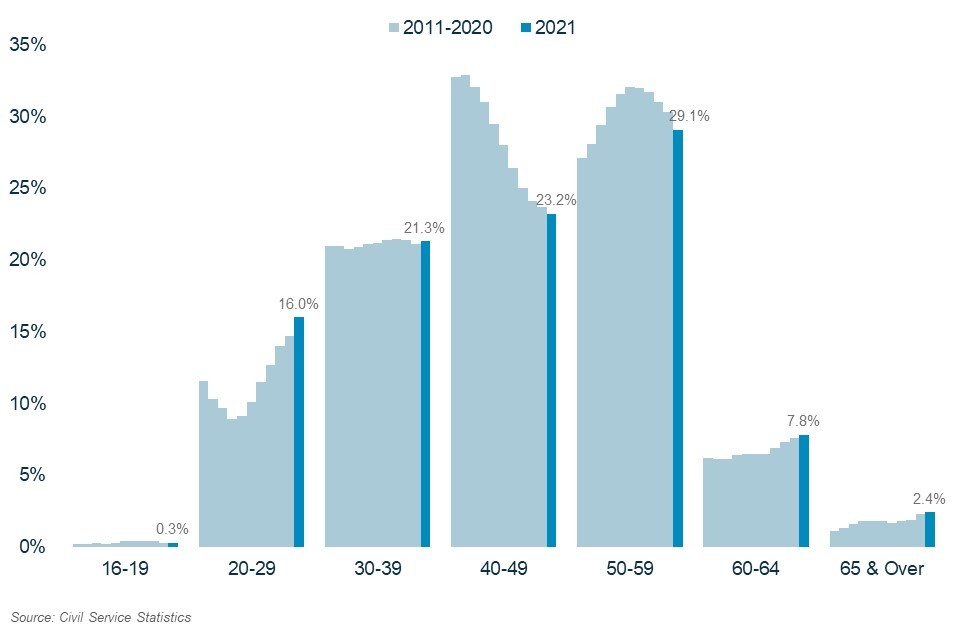
Almost two-thirds of civil servants who reported their age in March 2021 were aged over 40. The proportion of staff aged 40-49 has decreased from 32.6% in 2010 to 23.2% in 2021. In this time, the proportion of staff aged 50-59 has increased from 25.7% in 2010 to 29.1% in 2021.
Proportion of staff by age, 2010-2021
Bar chart showing age time series 2011-2021
1.8 Representation of different groups in the Senior Civil Service
Our most senior leaders are the Senior Civil Service, around 6,135 people.
1.9 Gender balance in the Senior Civil Service
Latest data show that 47.3% of Senior Civil Servants are women, as compared to 1996, when the figure was only 16.7%.
Women now make up at least half of Senior Civil Servants in four departments: the Department for Education; the Ministry of Justice; Department for Digital, Culture, Media and Sport; the Ministry of Housing, Communities and Local Government. Women only make up 32.6% of those in the Ministry of Defence.
Gender balance in the Senior Civil Service by department, 2021
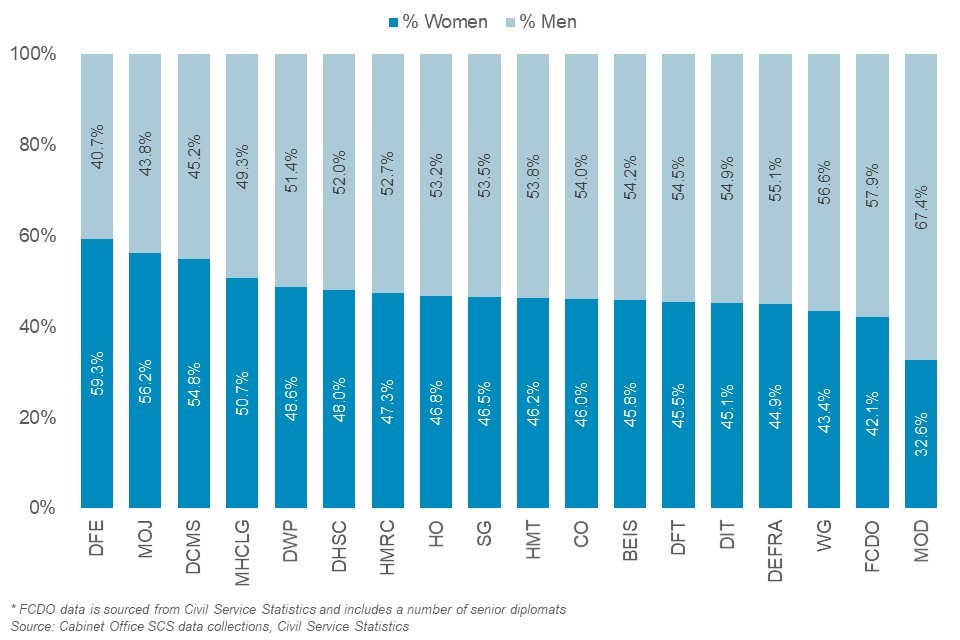
Stacked bar chart showing SCS gender balance 2021
As at March 2021, representation of women in the SCS varies from 32.6% at the Ministry of Defence to 59.3% at the Department for Education.
Representation of women in the SCS, 2010-2021
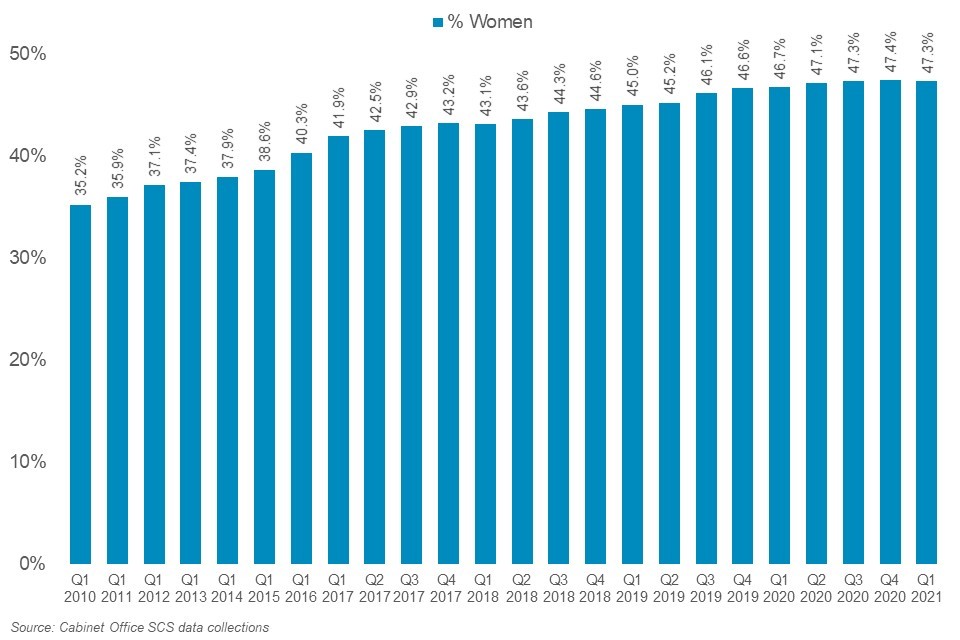
Bar chart showing SCS gender balance Q1 2010 to Q1 2021
As at March 2021, 47.3% of SCS are women. This percentage has increased every year since 2010, when it was 35.2%
1.10 Ethnicity and disability in the Senior Civil Service
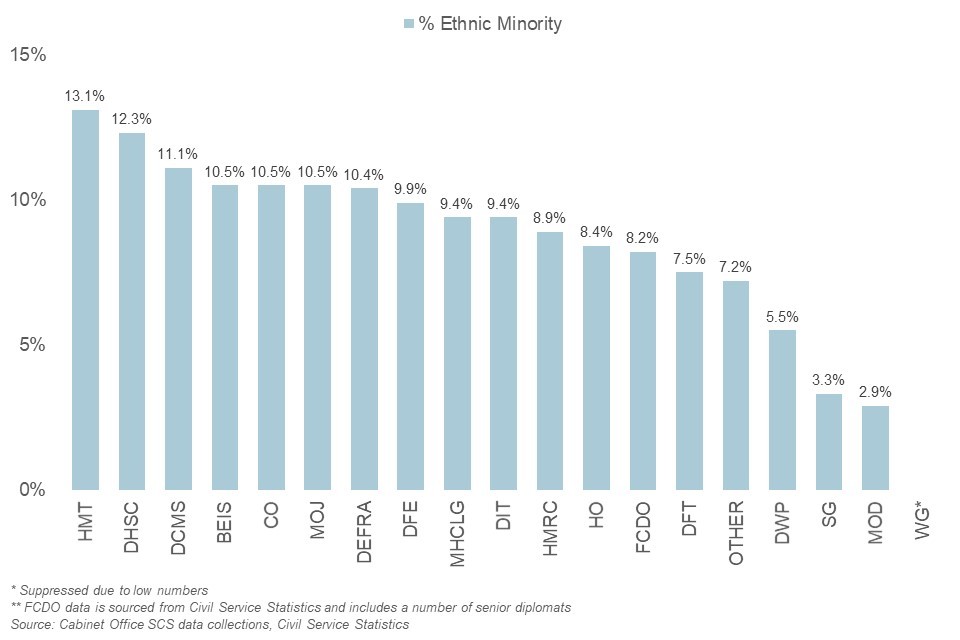
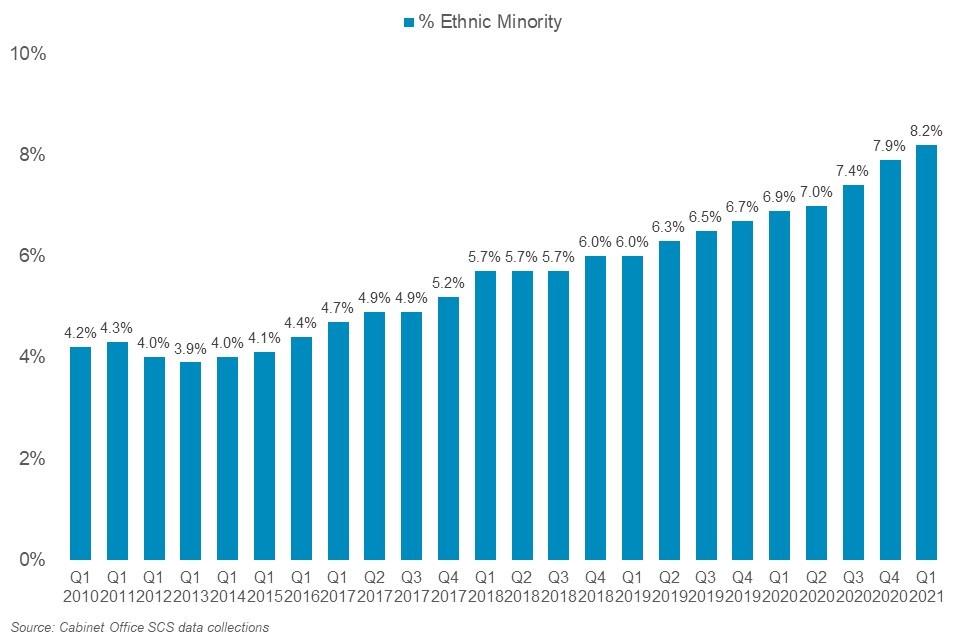
Recent increases in the representation of ethnic minority and disabled staff in grades 6 and 7 staff are beginning to be reflected in the SCS. As at March 2021, 6.1% of SCS are declared disabled and 8.2% are from ethnic minorities - a record high for ethnicity.
Representation of ethnic minorities in the SCS by department, 2021
Bar chart showing disabled percentage by department 2021
In 2021, representation of ethnic minority staff in the SCS varies from 13.1% at HM Treasury to 2.9% at the Ministry of Defence. Departments with fewer than five recorded ethnic minority staff have been suppressed
Representation of ethnic minorities in the SCS, 2010-2021
Bar chart showing ethnic minority percentage in SCS Q1 2010 - Q1 2021
As at March 2021, 8.2% of the SCS are ethnic minorities. This percentage has increased since 2010, when it was 4.2%.
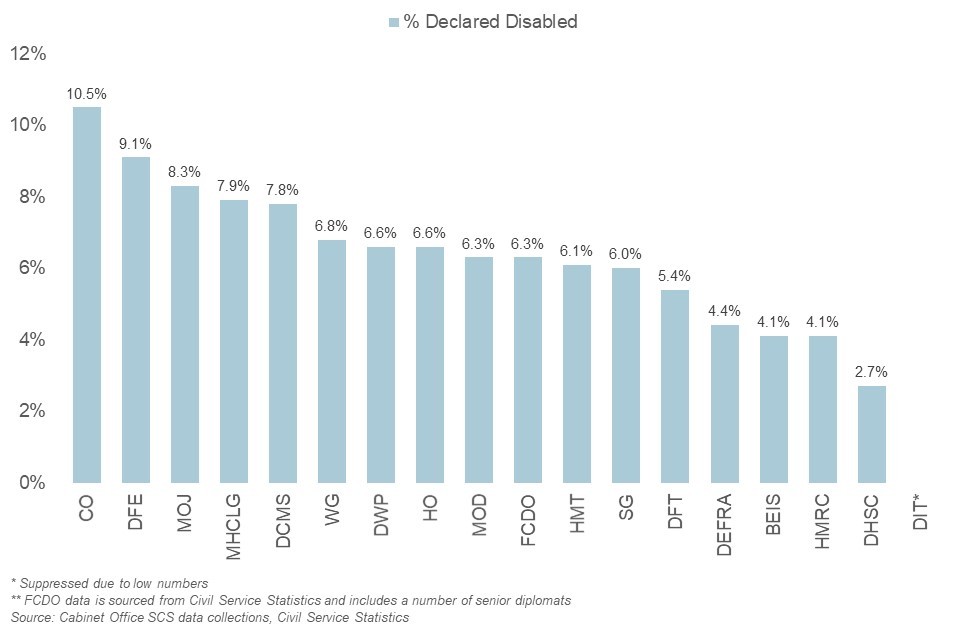
Representation of disabled staff in the SCS by department, 2021
Bar chart showing ethnic minority in SCS by department
In 2021, representation of disabled staff in the SCS varies from 10.5% at the Cabinet Office to 2.7% at the Department of Health and Social Care. Departments with fewer than five recorded disabled staff have been suppressed.
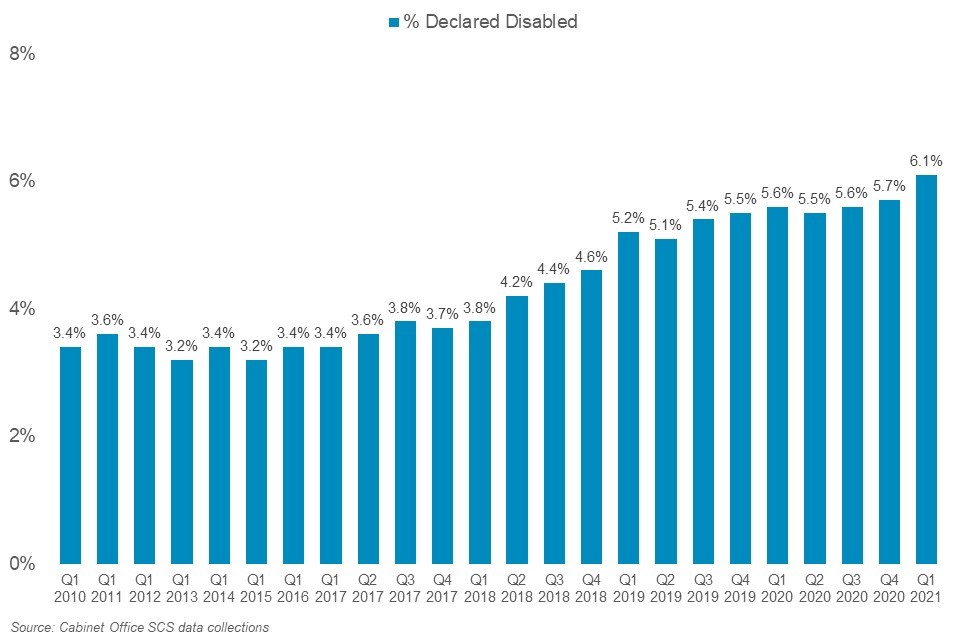
Representation of disabled staff in the SCS, 2010-2021
Bar chart showing ethnic minority in SCS Q1 2010 - Q1 2021
As at March 2021, 6.1% of the SCS have recorded a disability. This percentage has increased since 2010, when it was 3.4%
2. Inclusion: becoming the UK’s most inclusive employer
The Civil Service wants to become the UK’s most inclusive employer; building an inclusive culture in which everyone can thrive and where all our staff to be able to be themselves, feel valued and fairly treated.
2.1 Measuring inclusion
Inclusion is hard to measure and benchmark, so the Civil Service are working with the Chartered Institute of Personnel and Development to develop common measures of inclusion. In the meantime, the Civil Service People Survey (an annual staff survey, which invites all civil servants to share their views on working for their organisations) tells us a lot about the experience of different groups of staff. The Civil Service People Survey is sent to all civil servants each October, giving everyone the chance to have their say and help shape the future of where they work. In 2020 66% of all civil servants completed the People Survey. The headline measure of the survey is the employee engagement index, which measures employees’ commitment to their organisation in terms of pride, advocacy, personal attachment, and the extent to which their organisation motivates and inspires them.
2.2 Key results
Several of the questions in the People Survey relate to inclusion. The results from four questions, which ask staff how they feel they are treated at work, are used to make up an inclusion and fair treatment index or ‘theme score’. In the 2020 survey, this theme score is at an all time high of 82%, up from 79% in 2019. On average, 80% of staff feel their organisation is committed to creating a diverse and inclusive workplace in 2020, up from 76% in 2018.
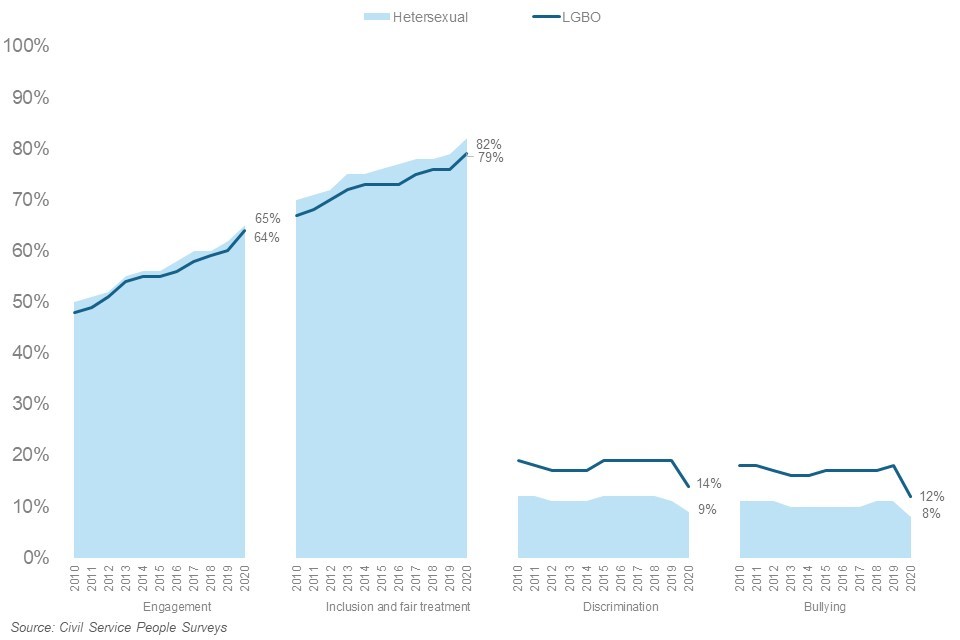
Related to inclusion and fair treatment, on average, 8% of staff reported in the 2020 People Survey that they had experienced bullying and harassment at work in the last 12 months, down from 12% in 2019. This overall figure masks differences between staff with different characteristics: rates of bullying and harassment were highest for staff who identify as a gender other than man or woman (20%), followed by staff with a long-term limiting condition (27%) and LGBO staff (12%).
2.3 Gender
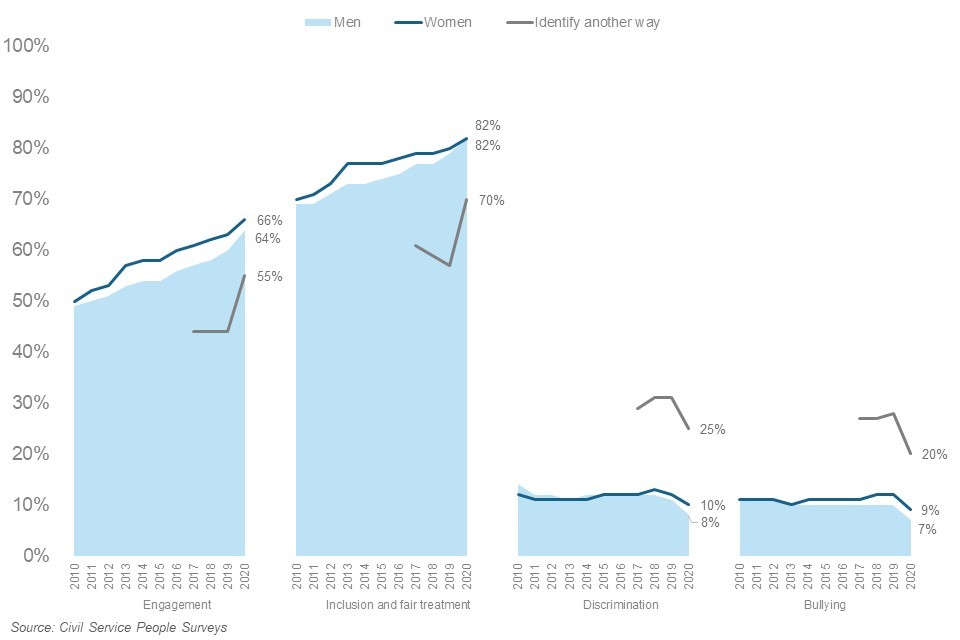
Men have slightly lower engagement and inclusion and fair treatment scores than women. Overall women report higher rates of discrimination, bullying and harassment than men. In 2020, staff who identify as a gender other than man or woman have the lowest scores for engagement (55%), inclusion and fair treatment (70%), and report the highest rates of discrimination, bullying and harassment.
People Survey: engagement, inclusion, discrimination and bullying scores of civil servants by gender, 2010-2020
CSPS scores by gender
Engagement and inclusion scores were higher for women than men every year since 2010. In 2020 the engagement score for men was 64%, compared to 66% for women. The percentages of staff who have experienced discrimination and bullying is now higher in women.
Those who identified as a gender other than male or female have much lower engagement (55%) and inclusion and fair treatment (70%) scores, than men or women. At 25% and 20%, the percentage of staff who identify as a gender other than male or female experiencing discrimination and bullying & harassment respectively are more than double than among men and women.
2.4 Ethnicity
Whilst ethnic minority staff (69%) have higher engagement scores than their white counterparts (65%), ethnic minority staff report higher levels of discrimination, bullying and harassment than white staff, and tend to score slightly lower on the inclusion and fair treatment theme score.
People Survey: engagement, inclusion, discrimination and bullying scores of civil servants by ethnicity, 2010-2020

CSPS scores by ethnicity
Engagement scores were higher for ethnic minorities than white staff every year since 2010. In 2019 the engagement score for white staff was 65%, compared to 69% for ethnic minority staff. The scores for inclusion are lower for ethnic minority staff, while the discrimination and bullying scores are higher for ethnic minorities.
2.5 Disability
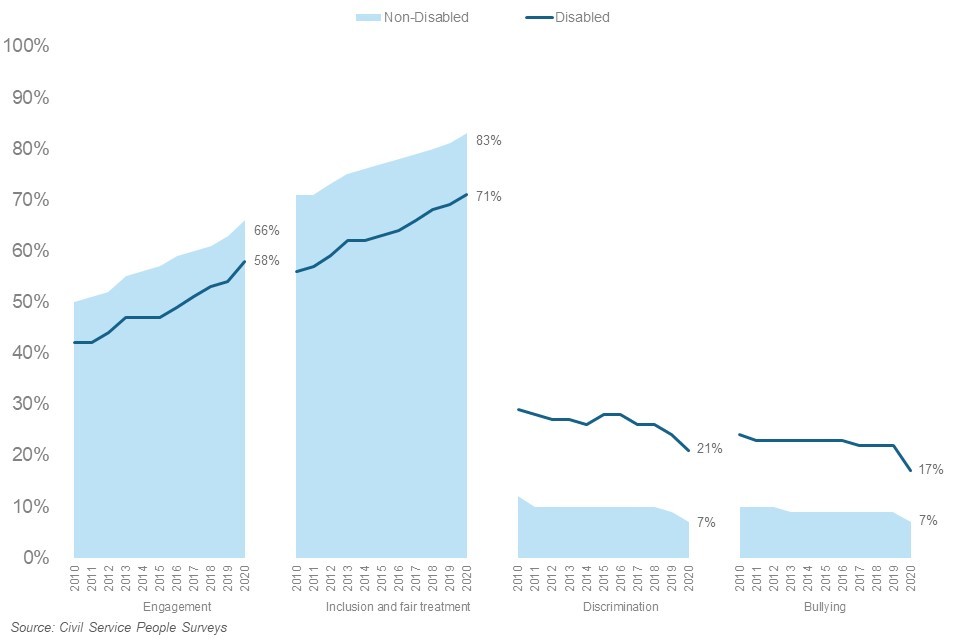
Disabled staff have much lower engagement and inclusion scores and report much higher levels of discrimination, bullying and harassment than non-disabled staff. In 2020, the inclusion and fair treatment score for disabled staff was 71%, compared to 83% for non-disabled staff.
People Survey: engagement, inclusion, discrimination and bullying scores by disability status, 2010-2020
CSPS scores by disability
Engagement and inclusion scores were lower for disabled staff than non-disabled staff every year since 2010. In 2020 the engagement score for non-disabled staff was 66%, compared to 58% for disabled staff. Discrimination and bullying scores for disabled staff are more than double those for non-disabled staff.
2.6 Sexual orientation
LGBO staff have tended to have slightly lower engagement and inclusion scores than heterosexual staff, and report much higher levels of discrimination and bullying and harassment. In 2020, the inclusion and fair treatment score for LGBO staff was 79%, compared to 82% for heterosexual staff.
People Survey: engagement, inclusion, discrimination and bullying scores by sexual orientation, 2010-2020
CSPS scores by sexual orientation
Engagement and inclusion scores were slightly higher for heterosexual staff than LGBO staff every year since 2010. In 2020 the engagement score for heterosexual staff was 65%, compared to 64% for LGBO staff. Discrimination and bullying scores for LGBO staff are higher than those for heterosexual staff.
3. Gender pay gap
The Civil Service has been publishing its own gender pay gap as part of Civil Service Statistics for many years, prior to the gender pay gap regulations being introduced.
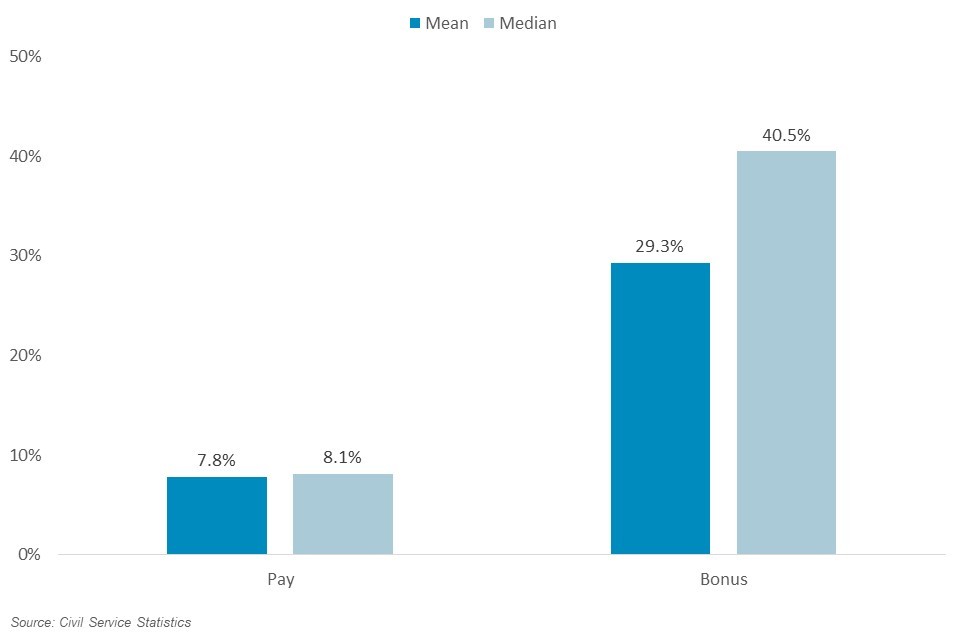
However, in 2020, the statutory gender pay gap methodology was aligned for the first time with Civil Service Statistics; the figures presented below are therefore aligned with the statutory reporting methodology. The median and mean gender pay gap for the Civil Service is 8.1% and 7.8% respectively. The median and mean bonus gap for the Civil service is 40.5% and 29.3% respectively.
3.1 Civil Service gender pay gap, full-time equivalent 2021
Gender pay gap overall
The gender pay gap measures the difference in pay of men and women but is not equivalent with measuring equal pay. The median gender pay gap compares the pay of women and men in the middle of their pay distributions. The mean gender pay gap also takes into account differences in pay at the top of the Civil Service when calculating the difference in pay.
The mean pay gap for 2021 ranges from 11.5% in the Department of Health and Social Care, to 2.8% in HMRC.
3.2 Mean difference in women’s hourly rate of pay compared to men by department, 2020 - 2021
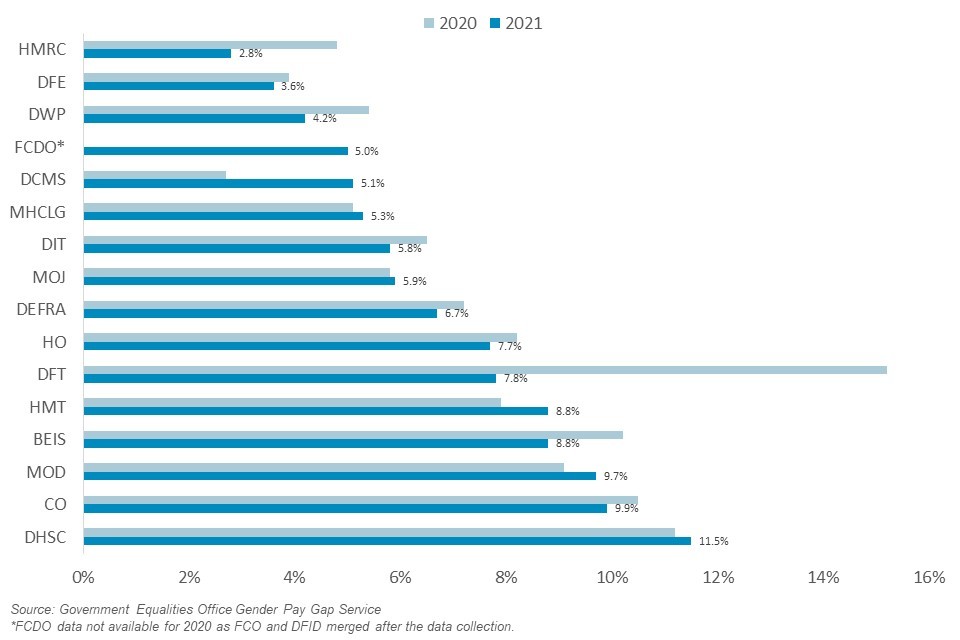
Gender pay gap by department 2021 vs 2020
4. Notes, sources and definitions page
This dashboard contains a mixture of official statistics and management information collected internally in the Cabinet Office. See below for a complete list of data sources used.
Public Sector Equality Duty: This publication is not intended to fulfil the requirement for Civil Service organisations to publish information annually to demonstrate compliance with the General Equality Duty.
Further information about ethnicity in the Civil Service can be found on the ethnicity facts and figures web pages.
4.1 Data sources
Civil Service Statistics, Cabinet Office
Latest data refer to March 2021, published July 2021. (Civil Service-wide breakdowns and representation below SCS by age, department, grade, religion, belief and non-belief, sexual orientation, ethnicity and disability. Data on age and religion, belief and non-belief for the SCS is also based on Civil Service Statistics.)
Civil Service People Survey, Cabinet Office
Latest data refer to 2020.
Cabinet Office SCS database, Cabinet Office
Latest data refer to March 2021. (Senior Civil Service level breakdowns for department, gender, ethnicity, sexual orientation, and disability.)
Gender Pay Service, Government Equalities Office
Latest data refer to March 2021.
Quarterly Public Sector Employment Statistics, ONS
Latest data refer to March 2021, published June 2021. (Civil Service-wide headline statistics by gender.)
UK Labour Market statistics, ONS
Latest data refer to March 2021, published June 2021. (Working population (economically active aged 16-64) by ethnicity and disability.)
4.2 Definitions
Department
Analysis by department includes executive agencies attached to the core department, in alignment with those used in ONS Civil Service Statistics.
Disabled
The Equality Act 2010 defines disability as a physical or a mental condition which has a substantial and long-term impact on your ability to do normal day to day activities. In the People Survey disability is reported as a Long-term limiting condition, illness or disability.
Gender Pay Gap
Since 2020, the Government Equalities Office (GEO) statutory reporting methodology has aligned to Civil Service Statistics. The GEO gender pay gap is defined as the difference in mean and median hourly rate between men and women. The gender pay gap is calculated as the difference between median hourly wage for women as a proportion of median hourly wage for men.
LGBO - Lesbian, Gay, Bisexual or ‘Other’
In the People Survey, civil servants are invited to record their sexual orientation as “Heterosexual/straight”, “Gay or lesbian”, “Bisexual” or “Other”. The term LGBO refers to staff who report belonging to one of the last three groups. When departments report their data to ONS, they are able to categorise sexual orientation as “Heterosexual/straight”, “Gay woman/lesbian”, “Gay man”, “Bisexual” or “Other”. In some cases where HR systems do not differentiate between “Gay woman/lesbian” and “Gay man”, it is likely that they are categorised using the recorded gender.
Senior Civil Service
There are two measures of the SCS available: The Senior Civil Service and SCS Level. The official headline figures used for monitoring diversity of The Senior Civil Service are sourced from the Cabinet Office SCS database that collects more frequent and comprehensive information on those individuals that make up The Senior Civil Service. Civil Service Statistics captures SCS level employees that includes a number of health professionals, military personnel and senior diplomats that are not part of The Senior Civil Service. Data on the SCS which are sourced from Civil Service Statistics are labelled as “SCS level”.
Working population
This term has been used to describe the ONS’ definition of Economically Active Population (i.e. the population who are working, have sought work in the last four weeks and/or are available to start work in the next two weeks).