Summer 2021 results analysis and quality assurance - A level and GCSE
Updated 20 August 2021
Applies to England

© Crown copyright 2021
This publication is licensed under the terms of the Open Government Licence v3.0 except where otherwise stated. To view this licence, visit nationalarchives.gov.uk/doc/open-government-licence/version/3 or write to the Information Policy Team, The National Archives, Kew, London TW9 4DU, or email: psi@nationalarchives.gov.uk.
Where we have identified any third party copyright information you will need to obtain permission from the copyright holders concerned.
This publication is available at https://www.gov.uk/government/publications/analysis-of-results-a-levels-and-gcses-summer-2021/summer-2021-results-analysis-and-quality-assurance-a-level-and-gcse
Overview
In January 2021 and in response to the coronavirus (COVID-19) pandemic, the government announced that it was no longer fair for many exams and assessments to go ahead as planned this summer. It was confirmed that students taking GCSE, AS and A levels regulated by Ofqual would be awarded grades based on an assessment by their teachers. Ofqual and the Department for Education consulted jointly on the alternative arrangements to summer exams, and the outcome of this consultation was announced in February. Teachers have used a range of evidence to make a judgement about the grade at which their students have performed, focusing on the content that students have been taught.
As part of these arrangements, exam boards have implemented a process of quality assurance. Each school and college was required to put in place an internal quality assurance process, which was defined in their centre policy. Centres’ internal quality assurance included internal standardisation of marking and grading judgements. As part of the external quality assurance, exam boards reviewed the centre policies for all centres. Exam boards also requested evidence from all centres and checked the evidence used to support teacher grades for some students in a sample of centres. We have been monitoring the quality assurance carried out by the exam boards and provide a brief overview in this report. We will provide more detail of our monitoring of exam board delivery in our report on the summer series that we will publish in December 2021.
Results days this summer are 10 August for AS and A levels, and 12 August for GCSEs. As in other years, JCQ publish national results statistics on results days. This includes overall outcomes for each qualification (GCSE, AS and A level), as well as a breakdown by subject group and gender. To supplement these analyses, we have provided further breakdowns in this report. This initial publication focuses on A level results, and further analyses of GCSE results will be added on 12 August. Given the small (and declining) entry for AS, we have not provided any breakdowns of results for AS qualifications.
Our analyses focus on qualifications regulated by Ofqual and include only students in England. Where appropriate, we focus on particular age groups – typically the target age group for each qualification (16-year-olds for GCSE and 18-year-olds for A level). Our results analyses are based on data submitted to Ofqual by exam boards around a week before results are issued. Given this, there is likely to be a small amount of missing data for results that were not processed at that time. This is unlikely to impact on the overall trends though, and any data that is missing is likely to be missing at random.
It should also be noted that there are some small differences in the figures that we have included in this report that relate to previous years, compared to the report that we published following summer 2020. This is generally due to us having updated data, but in the centre type analysis it is also due to us only including centres with entries in all years (meaning some centres that were included in the analysis that we published in 2020 do not have entries in 2021, so are excluded from the historical figures). Again, these small differences do not impact on the overall trends.
We have published a separate report for general qualifications examining outcomes for students with different protected characteristics and socio-economic status. We have also published 2 separate reports for vocational and technical qualifications, providing analyses of entries and outcomes, and outcomes for students with different protected characteristics.
Quality assurance
The policy this year was to trust teachers to assess their students and to decide on the grade that best reflects their performance. Students were only assessed on the parts of their courses they had been taught. Recognising that schools and colleges had been affected in different ways by the pandemic, the course of which was uncertain, schools and colleges were given wide discretion to decide how to assess their students. This allowed them to:
- take into account relevant work already undertaken and coursework or non-exam assessments
- set new assessments written by teachers or using questions provided by the exam boards
- vary the approach used for individual students where that was appropriate for their individual circumstances (for instance those lacking the same range of existing evidence as their peers, or who may not have received a reasonable adjustment they were entitled to at the time that previous assessments were completed)
Schools and colleges each set out in their centre policy how they would assess their students and determine their grades, within the guidance provided by the exam boards. The boards contacted schools and colleges as they were developing their policies to make sure that they understood what they were required to do.
These centre policies were then submitted to the exam boards who checked them all. Where exam boards had concerns about the approach a school or college planned to take, the school or college was required to make changes.
These policies explained the steps that schools and colleges would take to ensure that their grades were properly determined. This included making sure that teacher assessed grades (TAGs) were checked by at least 2 teachers. When submitting grades the head of each school and college also had to make a declaration confirming that they had been produced in line with the requirements and the centre’s policy.
After the TAGs were sent to the exam boards, the boards required each school and college to send in the work for a sample of subjects and students. The exam boards selected the subjects and the specific students for whom this work was to be sent in. Schools and colleges had 48 hours in which to submit their evidence.
The exam boards scrutinised a selection of the student work submitted. Factors which meant that a school or college was more likely to be selected for scrutiny included, for example, that the grades submitted for their entries this year looked unusual compared to those in previous years, or concerns about potential malpractice. The exam boards also looked at work from some schools and colleges selected at random. They made sure work from schools and colleges of all different types (for example, academies, independent schools, further education colleges and sixth form colleges) was looked at, and that schools and colleges from all regions were included. Student work from 1,101 centres in England, around 1 in 5 schools and colleges, was scrutinised in this way. Checks were also carried out on centres taking Ofqual-regulated GCSE, AS and A levels outside of England and the UK.
Students’ work was reviewed by subject experts (usually senior examiners) appointed by the exam boards, who checked that the TAGs submitted were supported by the evidence. Subject experts did not re-mark or moderate the work submitted, they looked at the evidence in the round, as teachers had been asked to do.
For 85% of the schools and colleges whose students’ work was scrutinised by the exam boards, the subject experts were satisfied that the evidence supported the TAGs that had been submitted. The remainder were subject to further scrutiny. This included professional conversations between the exam boards’ subject experts and centre staff, which covered both the samples of work submitted and the school or college’s approach to determining grades more generally.
Following these additional checks, in most cases the exam boards were satisfied either with the school or college’s original judgements or with the revised TAGs which they submitted.
At the time of writing this report, the exam boards were in continuing discussions with a small number of centres either because of issues identified through the quality assurance process or as a result of concerns about a centre’s practice raised directly with the exam boards or with Ofqual. Results will be withheld for these schools and colleges should these concerns remain unresolved on results day.
We will publish further information and statistics about the quality assurance process, and malpractice investigations and findings, later this year as part of our usual cycle of regulatory reporting and official statistics.
Analyses of A level results
This section provides an overview of our analyses of A level results. To provide context, we initially consider overall A level outcomes compared to 2020, by drawing on the results statistics published by JCQ (since these are most complete). As outlined above, our own analyses use data submitted to us by exam boards around a week before results are issued, meaning that there might be some small differences in the total number of students compared to the more complete JCQ figures. Unless otherwise noted, outcomes are presented as cumulative percentages throughout this report (including for the JCQ figures – meaning grade A outcomes refers to grade A and above).
Overall A level outcomes compared to 2020
JCQ have published overall A level results for summer 2021, including breakdowns by subject group and gender. These figures show that for all students in England, overall A level outcomes are higher at the top grades (A* to B) compared to 2020, and relatively stable at the lower grades (C to E)[footnote 1]. The greatest percentage point (pp) increase compared to summer 2020 is at grade A (+6.2pp), followed by grade A* (+4.8pp) and B (+4.4pp). At the lower grades, outcomes are within 1pp of the outcomes in summer 2020 (+0.7pp at grade C, -0.6pp at grade D, and -0.2pp at grade E). These trends are similar when considering all students or just 18-year-old students.
A level students are generally more able to study independently than younger students and have more study time for each subject. There has been an increase in outcomes at the top grades and stability at lower grades. This may be because the most academically able students were most able to study independently.
The JCQ figures also show that, although outcomes are higher than summer 2020 in all subjects at the top grades, the extent of the difference varies by subject and grade. For example, at grade A, outcomes are higher than 2020 to the greatest extent in music (+13.1pp), followed by physical education (+11.1pp) and design & technology (+9.4pp). Outcomes are higher than 2020 to the least extent in other sciences (+2.8pp), further maths (+4.0pp) and sociology and law (both +4.6%). At grade A* the pattern is slightly different, and the greatest difference compared to 2020 is for ‘other’ modern foreign languages (+19.2pp), followed by German (+11.2pp) and music (+10.5pp). The smallest increases compared to 2020 are for ‘other’ sciences (+0.8pp), law (+1.9%) and sociology (+2.4pp).
Number and average number of A level qualifications per student
The results statistics published by JCQ focus on A level entries (hence students will be counted multiple times if they have entered multiple qualifications). We have also conducted analyses at the student level, by combining data across exam boards. This has included calculating the average number of A levels per student and the number of A levels per student (for 18-year-olds taking at least one A level each year). Table 1 shows that the average number of A levels per student has remained stable over time. Furthermore, the number of A levels taken by individual students has also remained relatively stable (Table 2), with the majority (around two-thirds) taking 3 A levels. Only a small proportion of students took 4 or more A levels in summer 2021, as in previous years.
Table 1. Average number of A level qualifications per student
| 2017 | 2018 | 2019 | 2020 | 2021 | |
|---|---|---|---|---|---|
| A level | 2.67 | 2.68 | 2.66 | 2.67 | 2.67 |
Table 2. Percentage of students by the number of A levels taken per student
| Number of A levels | 2017 | 2018 | 2019 | 2020 | 2021 |
|---|---|---|---|---|---|
| 1 | 11.3 | 10.5 | 10.6 | 10.5 | 10.9 |
| 2 | 16.8 | 16.8 | 17.0 | 16.4 | 16.5 |
| 3 | 65.4 | 66.9 | 68.0 | 68.7 | 67.7 |
| 4 | 6.2 | 5.6 | 4.3 | 4.4 | 4.9 |
| 5+ | 0.3 | 0.2 | 0.1 | 0.1 | 0.1 |
A level grade combinations
As in 2020, we have considered the grade combinations achieved by students taking 3 A levels (the most prevalent number of A levels). Figure 1 shows the grade profiles (meaning the grades they achieved across the 3 qualifications), with attainment decreasing from left to right (3 A* grades on the left of the plot and 3 U grades on the right). For reference, the underlying data showing the percentages and cumulative percentages for each grade combination are provided in Table 3.
Because there are a large number of different grade combinations possible when a student has taken 3 A levels, we have combined some groups by using the # symbol to represent any grade that is lower than the first grade in each combination, for example CC# represents students awarded 2 C grades and a grade D, E, or U. The solid lines on the graph show the trajectories for 2017 to 2021. The percentages are cumulative such that they include the percentage of students achieving each grade combination or a higher combination. For example, the cumulative percentage for AAA will also include students achieving A*AA, A*A*A, and A*A*A*.
Figure 1 shows that the grade combinations received by individual students in 2021 are typically higher than in previous years. This can be seen clearly when the cumulative percentage of students awarded each grade combination is visualised. This is not surprising given that overall outcomes in 2021 are higher than previous years.
Figure 1. Cumulative percentage of students by A level grade combinations
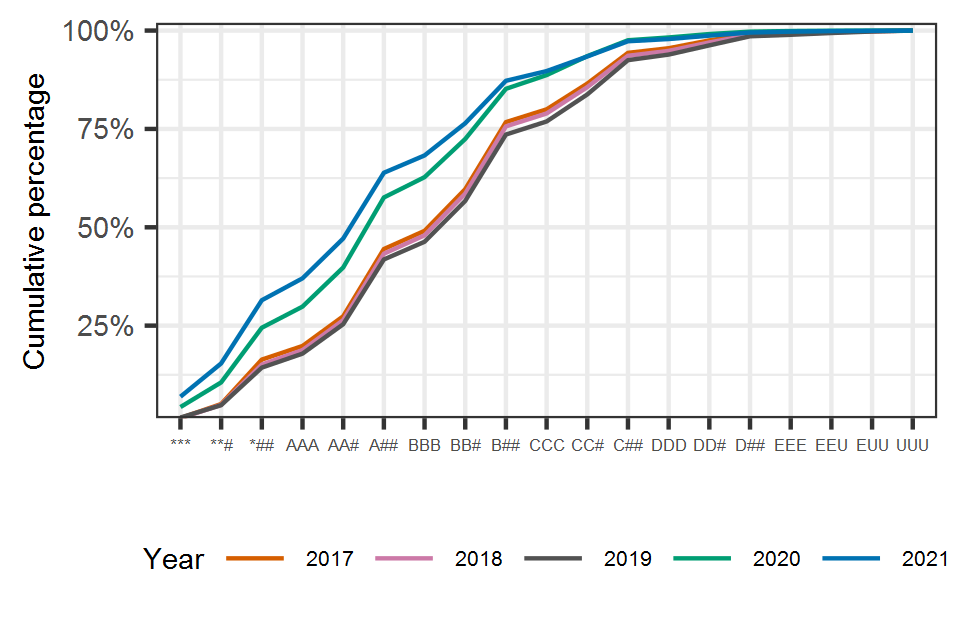
Line chart showing that A level grade combinations for individual students in 2021 are typically higher than in previous years.
Table 3. Percentage and cumulative percentage of students awarded A level grade combinations between 2017 and 2021
| Grade combination | % 2017 | % 2018 | % 2019 | % 2020 | % 2021 | Cum % 2017 | Cum % 2018 | Cum % 2019 | Cum % 2020 | Cum % 2021 |
|---|---|---|---|---|---|---|---|---|---|---|
| A*A*A* | 1.5 | 1.5 | 1.6 | 4.3 | 6.9 | 1.5 | 1.5 | 1.6 | 4.3 | 6.9 |
| A*A*# | 3.6 | 3.4 | 3.1 | 6.3 | 8.5 | 5.1 | 4.8 | 4.8 | 10.6 | 15.4 |
| A*## | 11.3 | 10.3 | 9.5 | 13.9 | 16.1 | 16.4 | 15.1 | 14.3 | 24.5 | 31.5 |
| AAA | 3.5 | 3.7 | 3.6 | 5.4 | 5.6 | 19.8 | 18.8 | 17.9 | 29.8 | 37.0 |
| AA# | 7.5 | 7.6 | 7.5 | 9.9 | 10.1 | 27.4 | 26.4 | 25.4 | 39.8 | 47.1 |
| A## | 17.1 | 16.9 | 16.5 | 17.8 | 16.7 | 44.5 | 43.3 | 41.8 | 57.6 | 63.9 |
| BBB | 4.6 | 4.7 | 4.5 | 5.2 | 4.4 | 49.1 | 48.0 | 46.3 | 62.7 | 68.3 |
| BB# | 10.6 | 10.6 | 10.4 | 9.7 | 8.2 | 59.7 | 58.6 | 56.7 | 72.5 | 76.5 |
| B## | 17.0 | 17.1 | 16.9 | 12.7 | 10.8 | 76.7 | 75.6 | 73.6 | 85.2 | 87.2 |
| CCC | 3.2 | 3.3 | 3.3 | 3.5 | 2.5 | 80.0 | 78.9 | 76.9 | 88.7 | 89.7 |
| CC# | 6.5 | 6.7 | 6.9 | 4.8 | 3.7 | 86.5 | 85.6 | 83.8 | 93.5 | 93.4 |
| C## | 7.8 | 8.0 | 8.7 | 4.0 | 3.9 | 94.3 | 93.6 | 92.5 | 97.5 | 97.3 |
| DDD | 1.2 | 1.2 | 1.4 | 0.7 | 0.6 | 95.5 | 94.8 | 93.9 | 98.2 | 97.9 |
| DD# | 2.0 | 2.1 | 2.3 | 0.9 | 0.9 | 97.5 | 97.0 | 96.2 | 99.1 | 98.7 |
| D## | 1.6 | 1.9 | 2.3 | 0.6 | 0.8 | 99.1 | 98.9 | 98.6 | 99.7 | 99.5 |
| EEE | 0.2 | 0.3 | 0.4 | 0.2 | 0.2 | 99.4 | 99.2 | 98.9 | 99.9 | 99.7 |
| EEU | 0.3 | 0.4 | 0.4 | 0.1 | 0.1 | 99.6 | 99.5 | 99.4 | 100.0 | 99.9 |
| EUU | 0.2 | 0.3 | 0.4 | 0.0 | 0.1 | 99.9 | 99.8 | 99.8 | 100.0 | 99.9 |
| UUU | 0.1 | 0.2 | 0.2 | 0.0 | 0.1 | 100.0 | 100.0 | 100.0 | 100.0 | 100.0 |
Grade A* in all A level subjects
Our analyses of grade combinations focus on those students who entered 3 A levels. We have also calculated the number of students who received an A* in all their A levels, regardless of the number of subjects that they entered. This is shown in Table 4 compared to previous years, and includes both the number and percentage of students.
The total number and percentage of students receiving an A* in all their subjects in 2021 is higher than in 2020. For all students, the percentage has increased from 5.3% in 2020 to 8.3% in 2021. Of the students taking 3 A levels (the most common number of A levels), the percentage has increased from 4.3% in 2020 to 6.9% in 2021. In both years, just under 60% of these students are female.
Table 4. Number and percentage of students receiving an A* in all their A level subjects
| Number of A levels | 2017 | 2018 | 2019 | 2020 | 2021 | % 2017 | % 2018 | % 2019 | % 2020 | % 2021 |
|---|---|---|---|---|---|---|---|---|---|---|
| 1 | 2,511 | 2,570 | 2,980 | 2,973 | 4,888 | 5.4 | 5.9 | 7.1 | 8.4 | 12.6 |
| 2 | 443 | 507 | 496 | 1,046 | 2,051 | 0.9 | 1.0 | 1.0 | 2.2 | 4.2 |
| 3 | 2,718 | 2,664 | 3,007 | 7,774 | 12,945 | 1.5 | 1.5 | 1.6 | 4.3 | 6.9 |
| 4 | 1,184 | 1,310 | 1,190 | 2,734 | 3,863 | 6.6 | 8.5 | 9.9 | 23.2 | 28.2 |
| 5+ | 65 | 60 | 28 | 64 | 96 | 7.2 | 9.9 | 10.8 | 30.9 | 39.5 |
| Total | 6,921 | 7,111 | 7,701 | 14,591 | 23,843 | 2.3 | 2.5 | 2.7 | 5.3 | 8.3 |
A level entries from private candidates
Private candidates entering GCSE, AS and A levels this summer have been assessed on a range of evidence, in a similar way to other students. We have collected data from exam boards that provides an indication of the number of entries from private candidates. It is important to note that our figures are only an estimate of the total number of entries from private candidates since exam boards rely on centres identifying if an entry is from a private candidate, and we know that this is not always done consistently. As such, our figures represent the number of entries that are reported (by centres) as being from private candidates. This means that making comparisons over time is challenging, since it is possible that centres may have been more consistent in some years than others when identifying entries from private candidates. It is also possible that the data is more consistent in some subjects than others.
Table 5 shows the total number of entries from private candidates in 2021 compared to previous years (a further breakdown by subject is provided in Annex A). While the number of entries from private candidates has fluctuated over time (and there were fewer entries from private candidates last summer given the approach to grading), as outlined above, it is difficult to draw any firm conclusions given that the figures can only be considered an estimate.
Table 5. Number of A level entries reported (by centres) as being from private candidates
| 2017 | 2018 | 2019 | 2020 | 2021 | |
|---|---|---|---|---|---|
| A level | 16,753 | 13,433 | 13,950 | 4,904 | 7,424 |
Variability in A level centres’ results
As in previous years, we have published interactive analytics showing the variability in centres’ outcomes compared to 2020. These charts (an example of which is shown in Figure 2), plot the change in outcomes for individual centres in each subject at grade A and above (for A level) compared to 2020. The summary statistics show the average (mean) change in centres’ outcomes compared to the previous year, and the spread (standard deviation) of the changes in outcomes (a higher standard deviation suggests that centres’ outcomes are generally more variable, while a lower standard deviation suggests that centres’ outcomes are generally less variable).
In general, for centres with more than 20 entries in a subject, the variation in centres’ results is lower than it was in 2019, but slightly greater compared to 2020 (although this is not the case for every subject). This suggests that the assessment arrangements lessened the impact of the pandemic on centres’ results – otherwise we would expect to see much greater variability in centres’ results this year compared to the past. On our interactive analytics page it is possible to tailor the charts to focus on different age groups, centre sizes and stability of centres (the extent to which the number of entries for individual centres has remained stable over time).
Figure 2. Centre variability for A level maths – summer 2020 vs. summer 2021

A graph demonstrating the trend that most centres show lower levels of variability in 2021 at grade A and above for A level maths.
A level outcomes by centre type
We have compared the results of different types of centre across 2021, 2020 and 2019. Tables 6 to 8 show the number of centres and entries by centre type, the outcomes by centre type, and the relative and absolute change in outcomes over time, respectively, at grades A* to C. We have used the centre types from the national centre number (NCN) register. This analysis only includes centres with entries in all 3 years (hence there are some small differences for previous years compared to the figures that we published in our results report last December).
Outcomes for all types of centre have increased compared to 2020. The extent to which they have increased may partly reflect longstanding differences in the distribution of grades for different centre types. For example, in normal years, the distribution of grades for students attending independent centres is clustered around the top grades. A uniform increase in grades awarded across all types of school and college is therefore most likely to benefit students attending independent schools at the top grades. For other centre types, the impact of increased grades may be lower down the grade distribution – wherever most of their candidates are normally clustered.
This clustering of students at different points in the grade distribution means it is helpful to consider both the relative and absolute changes in outcomes across centre types. This is because relative changes on small numbers often look big, but relative changes on big numbers often look small. On the other hand, absolute changes on small numbers often look small, but absolute changes on big numbers often look big. Therefore, it is important to explore both types of change.
At grade A, the largest relative increase is for ‘other’ centres[footnote 2] (+22.5%), further education establishments (+21.4%) and secondary comprehensives (+18.7%), and the smallest increase is for sixth form colleges (+12.0%). The increases for independent centres and academies at grade A are partway between the highest and lowest changes (+15.2% and +15.8%, respectively). At grade C, the relative changes are similar across centre types, ranging from -0.1% to +2.2% compared to 2020. The smaller changes at grade C reflect the overall stability in outcomes at this grade compared to 2020.
In absolute terms, the increase in outcomes at grade A is largest for ‘other’ centres (+9.4pp) and independent centres (+9.3pp). At grade C, outcomes are relatively stable for all centre types, reflecting the stability in overall outcomes. The largest increases at grade C are for ‘other’ centres (+1.9pp) and free schools (+1.6pp). Exam boards looked at student work from all types of school and college as part of the external quality assurance process. They did not find that any type of school or college was more likely than others to have provided grades that did not reflect the standard of their students’ work. Indeed, they found that, irrespective of the type of school or college, the grades were largely supported by the quality of students’ work. It is also worth noting that more able students are also generally more capable of independent study.
Table 6. A level entries by centre type compared to 2019 and 2020
| Centre Type | N centres | Entries 2019 | Entries 2020 | Entries 2021 |
|---|---|---|---|---|
| Academy | 1,155 | 285,968 | 283,038 | 296,475 |
| FE Establishment | 81 | 20,381 | 21,303 | 22,783 |
| Free Schools | 39 | 7,331 | 7,877 | 8,728 |
| Independent | 520 | 95,864 | 92,562 | 93,853 |
| Other | 90 | 6,713 | 6,324 | 8,101 |
| Sec Comp or Middle | 499 | 100,970 | 99,300 | 104,656 |
| Secondary Modern | 30 | 3,099 | 3,241 | 3,396 |
| Secondary Selective | 78 | 31,956 | 31,929 | 32,490 |
| Sixth Form College | 105 | 118,016 | 118,699 | 122,047 |
| Tertiary College | 28 | 18,944 | 19,232 | 20,750 |
Table 7. A level cumulative percentage outcomes by centre type compared to 2019 and 2020
| Centre Type | Cum % grade A* 2019 | Cum % grade A 2019 | Cum % grade B 2019 | Cum % grade C 2019 | Cum % grade A* 2020 | Cum % grade A 2020 | Cum % grade B 2020 | Cum % grade C 2020 | Cum % grade A* 2021 | Cum % grade A 2021 | Cum % grade B 2021 | Cum % grade C 2021 |
|---|---|---|---|---|---|---|---|---|---|---|---|---|
| Academy | 7.0 | 23.7 | 49.9 | 75.3 | 13.2 | 36.2 | 64.0 | 87.1 | 17.1 | 41.9 | 68.3 | 87.7 |
| FE Establishment | 2.7 | 12.2 | 35.4 | 63.9 | 6.8 | 23.7 | 51.5 | 80.0 | 8.9 | 28.8 | 56.0 | 81.0 |
| Free Schools | 7.7 | 26.7 | 51.9 | 73.2 | 15.5 | 40.0 | 66.7 | 87.2 | 19.2 | 46.6 | 72.0 | 88.8 |
| Independent | 16.1 | 44.0 | 70.8 | 87.5 | 27.4 | 60.8 | 84.3 | 95.8 | 39.5 | 70.1 | 88.3 | 96.4 |
| Other | 6.3 | 20.5 | 40.2 | 62.9 | 16.1 | 41.7 | 66.9 | 86.6 | 24.8 | 51.1 | 72.7 | 88.5 |
| Sec Comp or Middle | 5.5 | 20.0 | 45.6 | 72.2 | 11.4 | 33.1 | 61.2 | 86.0 | 15.3 | 39.3 | 66.0 | 86.7 |
| Secondary Modern | 4.9 | 17.3 | 38.6 | 64.2 | 10.6 | 29.9 | 56.8 | 83.5 | 14.0 | 35.3 | 61.3 | 83.6 |
| Secondary Selective | 11.7 | 36.1 | 63.6 | 83.4 | 20.1 | 49.1 | 75.2 | 91.9 | 25.8 | 56.6 | 79.4 | 92.2 |
| Sixth Form College | 6.1 | 21.9 | 48.5 | 74.5 | 10.4 | 31.5 | 60.0 | 84.6 | 12.3 | 35.3 | 63.2 | 85.0 |
| Tertiary College | 5.1 | 20.6 | 48.6 | 75.4 | 9.3 | 30.0 | 60.4 | 86.0 | 12.1 | 34.5 | 63.6 | 85.9 |
Table 8. A level relative and absolute changes by centre type compared to 2020
| Centre Type | Grade A* 2021 to 2020 relative change | Grade A 2021 to 2020 relative change | Grade B 2021 to 2020 relative change | Grade C 2021 to 2020 relative change | Grade A* 2021 to 2020 absolute change (pp) | Grade A 2021 to 2020 absolute change (pp) | Grade B 2021 to 2020 absolute change (pp) | Grade C 2021 to 2020 absolute change (pp) |
|---|---|---|---|---|---|---|---|---|
| Academy | 29.8% | 15.8% | 6.8% | 0.7% | 3.9 | 5.7 | 4.3 | 0.6 |
| FE Establishment | 31.4% | 21.4% | 8.7% | 1.2% | 2.1 | 5.1 | 4.5 | 1.0 |
| Free Schools | 24.5% | 16.6% | 8.0% | 1.8% | 3.8 | 6.6 | 5.3 | 1.6 |
| Independent | 44.1% | 15.2% | 4.7% | 0.6% | 12.1 | 9.3 | 4.0 | 0.6 |
| Other | 53.4% | 22.5% | 8.8% | 2.2% | 8.6 | 9.4 | 5.9 | 1.9 |
| Sec Comp or Middle | 34.0% | 18.7% | 7.7% | 0.8% | 3.9 | 6.2 | 4.7 | 0.7 |
| Secondary Modern | 31.8% | 18.0% | 7.8% | 0.1% | 3.4 | 5.4 | 4.5 | 0.1 |
| Secondary Selective | 28.8% | 15.2% | 5.5% | 0.3% | 5.8 | 7.5 | 4.2 | 0.3 |
| Sixth Form College | 18.6% | 12.0% | 5.3% | 0.5% | 1.9 | 3.8 | 3.2 | 0.4 |
| Tertiary College | 30.6% | 15.0% | 5.3% | -0.1% | 2.8 | 4.5 | 3.2 | -0.1 |
A level outcomes by region
JCQ have published regional A level results (cumulative percentages) that we have replicated below in Table 9 for grades A and C (other grades are available via JCQ). The rank order of regions according to their results is broadly similar to 2020 and the percentage of students achieving grade A has increased in all regions. As is the case every year, there is some variation in the size of the increase across regions. At grade A the greatest increase was in London where the rate increased by 7.2pp compared to 2020. At grade C the greatest increase was in the East Midlands where the rate increased by 1.6pp compared to 2020. As with the differences seen across centre types, these regional changes will partly reflect the well-established clustering of students around different parts of the grade distribution.
Table 9. A level cumulative percentage outcomes and percentage point (pp) changes by region compared to 2020
| Region | Cum % grade A 2020 | Cum % grade C 2020 | Cum % grade A 2021 | Cum % grade C 2021 | Grade A change (pp) 2021 to 2020 | Grade C change (pp) 2021 to 2020 |
|---|---|---|---|---|---|---|
| North East | 35.6 | 88.1 | 39.2 | 87.7 | 3.6 | -0.4 |
| North West | 35.8 | 87.0 | 41.4 | 87.6 | 5.6 | 0.6 |
| Yorkshire and the Humber | 35.0 | 86.7 | 41.1 | 87.6 | 6.1 | 0.9 |
| West Midlands | 35.0 | 86.1 | 40.9 | 87.2 | 5.9 | 1.1 |
| East Midlands | 34.5 | 85.4 | 41.3 | 87.0 | 6.8 | 1.6 |
| Eastern Region | 38.3 | 87.5 | 44.8 | 88.5 | 6.5 | 1.0 |
| South West | 38.8 | 88.1 | 44.7 | 88.1 | 5.9 | 0.0 |
| South East | 41.2 | 88.7 | 47.1 | 89.2 | 5.9 | 0.5 |
| London | 40.7 | 88.1 | 47.9 | 88.9 | 7.2 | 0.8 |
Analyses of GCSE results
This section provides an overview of our analyses for GCSE. The analyses are broadly similar to those undertaken for A level. However, given that students typically take a larger number of subjects at GCSE, some of the A level analyses are not replicated here – in particular, those relating to grade combinations. This is also because those analyses are more relevant to A level results, since they are directly relevant to HE admissions. As for A level, our analyses use data submitted to us by exam boards around a week before results are issued, meaning that there might be some small differences in the total number of students compared to the more complete JCQ figures.
Overall GCSE outcomes compared to 2020
JCQ have published overall GCSE results for summer 2021, including breakdowns by subject group and gender. These figures show that for all students in England, overall GCSE outcomes are higher at grade 7 compared to 2020 (+2.6pp), and relatively stable at grade 4 (+1.0pp) and grade 1 (-0.6pp). The trends are similar when considering outcomes for 16-year-olds, with the greatest increase at grade 7 (+2.5%), and relatively stable outcomes at grade 4 (+0.3pp) and grade 1 (-0.4pp).
The JCQ figures also show that, although outcomes are higher than summer 2020 in all subjects at the top grades, the extent of the differences vary by subject. For example, at grade 7 outcomes are higher than 2020 for all students to the greatest extent in physical education (+7.1pp), followed by economics (+6.3pp) and computing and social science subjects (both +5.9pp). The smallest increase at grade 7 is for art and design (+0.6pp) and ‘other’ sciences (+0.9pp). At grade 4 the pattern is slightly different and outcomes are more stable compared to 2020, with increases in some subjects and decreases in others.
Number and average number of GCSE qualifications per student
As for A level, we have calculated the average number of GCSEs per student and the number of GCSEs per student (for 16-year-olds taking at least one GCSE each year). Table 10 shows that the average number of GCSEs per student has remained relatively stable over time, and consistent between 2020 and 2021. Furthermore, the number of qualifications per student has also remained relatively stable (Table 11), with the majority of students taking 7 to 9 GCSEs. There has been a slight increase in the percentage of students taking 7 or 8 GCSEs over time, and a slight decrease in the percentage of students taking 9 or 10+ GCSEs.
Table 10. Average number of GCSE qualifications per student
| 2018 | 2019 | 2020 | 2021 | |
|---|---|---|---|---|
| Average GCSEs | 8.09 | 7.90 | 7.84 | 7.85 |
Table 11. Percentage of students by the number of GCSEs taken per student
| Number of GCSEs | 2018 | 2019 | 2020 | 2021 |
|---|---|---|---|---|
| 1 | 1.7 | 1.5 | 1.3 | 1.2 |
| 2 | 1.9 | 2.0 | 1.9 | 1.8 |
| 3 | 1.7 | 1.7 | 1.7 | 1.5 |
| 4 | 1.6 | 1.6 | 1.9 | 1.7 |
| 5 | 2.5 | 3.0 | 3.2 | 2.8 |
| 6 | 5.4 | 7.5 | 7.9 | 7.9 |
| 7 | 11.8 | 15.0 | 15.8 | 16.6 |
| 8 | 21.6 | 23.1 | 23.7 | 24.6 |
| 9 | 30.1 | 27.0 | 26.5 | 27.1 |
| 10+ | 21.6 | 17.7 | 16.1 | 15.0 |
Grade 9 in reformed GCSE subjects
As in previous years, we have calculated the number of 16-year-old students in England who entered 7 or more GCSEs and received a grade 9 in all subjects. Table 12 shows that the number of students receiving all grade 9s is higher in 2021 compared to previous years – 3,606 students compared to 2,645 in 2020 and 837 in 2019 (note that in 2019 reformed GCSEs were not yet available in a small number of language subjects). The gender split for students receiving all grades 9s is similar to previous years (just under two thirds of students are female).
Table 12. Number of 16-year-old students receiving grade 9s in all GCSEs
| Number of GCSEs | 2019 | 2020 | 2021 |
|---|---|---|---|
| 7 | 78 | 212 | 287 |
| 8 | 93 | 344 | 469 |
| 9 | 240 | 732 | 1,058 |
| 10 | 293 | 1,041 | 1,454 |
| 11 | 123 | 291 | 322 |
| 12 | 10 | 25 | 16 |
| Total | 837 | 2,645 | 3,606 |
Post-16 outcomes for GCSE English language and maths
On GCSE results day each year, we typically publish outcomes for post-16 students in English language and maths, broken down by age (17-year-olds, 18-year-olds, and 19+)[footnote 3]. These are shown below for 2021 in Table 13. Because the number of post-16 entries has changed in 2021 for both subjects we have not compared outcomes in 2021 to previous years, since the nature of the cohort might also have changed meaning that comparisons over time might be misleading.
Table 13 shows that there are differences in outcomes between age groups, although this is likely to reflect the nature of the candidates. For example, entries from 17-year-olds are likely to be from students who did not achieve a grade 4 at age 16 and who are required to continue studying these subjects to be funded post-16. Entries from 19-year-olds are adult learners who may have different reasons for entering these subjects at GCSE.
Table 13. Post-16 GCSE English language and maths cumulative percentage outcomes
| Subject and age | Cum % grade 7 | Cum % grade 4 |
|---|---|---|
| English language, age 17 | 2.5 | 38.1 |
| English language, age 18 | 1.4 | 40.6 |
| English language, age 19+ | 6.7 | 50.6 |
| Maths, age 17 | 1.8 | 33.4 |
| Maths, age 18 | 0.6 | 36.1 |
| Maths, age 19+ | 2.9 | 48.8 |
GCSE entries from private candidates
As for A level, we have provided the number of GCSE entries that are reported (by centres) as being from private candidates in summer 2021. These figures should be considered an estimate of the total number of entries from private candidates, since the limitations of the data, as described above, also apply to GCSE (meaning the figures that we obtain from exam boards rely on centres identifying if an entry is from a private candidate, and this is not always done consistently). This means that making comparisons over time is challenging.
Table 14 shows the total number of entries reported as being from private candidates (by centres) in 2021 compared to previous years (a further breakdown by subject is provided in Annex B). While the number of entries from private candidates has fluctuated over time (and there were fewer entries from private candidates last summer given the approach to grading), as outlined above, it is difficult to draw any conclusions given that the figures can only be considered an estimate.
Table 14. Number of GCSE entries reported (by centres) as being from private candidates
| 2017 | 2018 | 2019 | 2020 | 2021 | |
|---|---|---|---|---|---|
| GCSE | 14,845 | 15,180 | 14,326 | 8,939 | 12,660 |
Variability in GCSE centres’ results
We have published interactive analytics showing the variability in centres’ GCSE outcomes compared to 2020. These charts follow the same format as outlined above, and our interactive apps allow users to tailor the charts to focus on different age groups, centre sizes and stability of centres (the extent to which the number of entries for individual centres has remained stable or changed over time).
Generally, at grade 7 (for centres with more than 25 entries in a particular subject), variation in centres’ results is lower than it was in 2019 and only slightly greater than in 2020 (although this is not the case for every subject). Generally, at grade 4 variation in centres’ results is less in 2021 compared to 2020 and 2019 (although again not for every subject). This suggests that the assessment arrangements lessened the impact of the pandemic on centres’ results – otherwise we would expect to see much greater variability in centres’ results this year compared to the past.
GCSE outcomes by centre type
As for A level, we have calculated outcomes by centre type compared to 2019 and 2020, and have calculated the relative and absolute change in outcomes at grades 7 and 4 compared to 2020. Tables 15 to 17 show the number of centres and entries by centre type, the cumulative percentage outcomes, and the relative and absolute changes compared to 2020, respectively. This analysis only includes centres with entries in all 3 years (hence there are some small differences for 2019 and 2020 compared to the figures that we published in our results report last December).
In relative terms, the largest increase compared to 2020 at grade 7 is for sixth form colleges (+50.8%) and further education establishments (+46.1%), and the smallest increase is for secondary selective (+4.2%) and independent schools (+7.1%). At grade 4, the largest increase is for further education establishments (+16.2%), tertiary colleges (+12.1%), ‘other’ centres (+8.2%) and sixth form colleges (+5.6%). For all other centre types (including secondary comprehensives and academies) the relative change is very small at grade 4 (less than 1%).
In absolute terms, there are some small differences in the extent to which outcomes differ compared to 2020 by centre type and grade. At grade 7, outcomes are higher than 2020 to a slightly greater extent for independent schools (+4.0pp) and free schools (+3.6pp). When considering outcomes at grade 4 though, the differences compared to 2020 are greatest for further education establishments (+5.3pp) and tertiary colleges (+4.9pp).
Exam boards looked at student work from all types of school and college as part of the external quality assurance process. They did not find that any type of school or college was more likely than others to have provided grades that did not reflect the standard of their students’ work. Indeed, they found that, irrespective of the type of school or college, the grades were usually supported by the quality of students’ work. The changes may therefore reflect the uneven impact of the pandemic which will have been lessened by the assessment arrangements. It is also worth noting that more able students might be more capable of independent study.
Table 15. GCSE entries by centre type compared to 2019 and 2020
| Centre Type | N centres | Entries 2019 | Entries 2020 | Entries 2021 |
|---|---|---|---|---|
| Academy | 2,010 | 2,663,887 | 2,735,503 | 2,773,089 |
| FE Establishment | 330 | 198,417 | 221,665 | 200,481 |
| Free Schools | 136 | 66,435 | 70,569 | 72,704 |
| Independent | 856 | 227,650 | 233,147 | 234,377 |
| Other | 857 | 73,571 | 78,590 | 75,500 |
| Sec Comp or Middle | 1,025 | 1,404,561 | 1,441,248 | 1,466,482 |
| Secondary Modern | 70 | 76,851 | 78,335 | 80,337 |
| Secondary Selective | 85 | 109,203 | 111,517 | 115,568 |
| Sixth Form College | 100 | 29,176 | 30,767 | 24,926 |
| Tertiary College | 54 | 35,043 | 37,629 | 34,024 |
Table 16. GCSE cumulative percentage outcomes by centre type compared to 2019 and 2020
| Centre Type | Cum % grade 7 2019 | Cum % grade 4 2019 | Cum % grade 7 2020 | Cum % grade 4 2020 | Cum % grade 7 2021 | Cum % grade 4 2021 |
|---|---|---|---|---|---|---|
| Academy | 20.7 | 69.1 | 25.9 | 77.8 | 28.1 | 78.2 |
| FE Establishment | 1.0 | 24.1 | 1.7 | 32.8 | 2.4 | 38.2 |
| Free Schools | 20.5 | 68.8 | 26.2 | 79.0 | 29.8 | 79.0 |
| Independent | 46.6 | 89.9 | 57.2 | 95.6 | 61.2 | 95.5 |
| Other | 7.3 | 36.9 | 10.4 | 50.2 | 13.1 | 54.3 |
| Sec Comp or Middle | 18.4 | 67.3 | 23.7 | 77.0 | 26.1 | 77.3 |
| Secondary Modern | 13.8 | 61.7 | 18.0 | 72.0 | 20.4 | 71.5 |
| Secondary Selective | 57.9 | 96.7 | 65.6 | 98.9 | 68.4 | 98.7 |
| Sixth Form College | 2.5 | 33.6 | 3.7 | 47.7 | 5.6 | 50.3 |
| Tertiary College | 4.4 | 31.0 | 5.3 | 40.7 | 6.5 | 45.7 |
Table 17. GCSE relative and absolute changes by centre type compared to 2020
| Centre Type | Grade 7 2021-2020 relative change | Grade 4 2021-2020 relative change | Grade 7 2021-2020 absolute change (pp) | Grade 4 2021-2020 absolute change (pp) |
|---|---|---|---|---|
| Academy | 8.6% | 0.5% | 2.2 | 0.4 |
| FE Establishment | 46.1% | 16.2% | 0.8 | 5.3 |
| Free Schools | 13.8% | 0.0% | 3.6 | 0.0 |
| Independent | 7.1% | -0.1% | 4.0 | -0.1 |
| Other | 26.1% | 8.2% | 2.7 | 4.1 |
| Sec Comp or Middle | 9.7% | 0.3% | 2.3 | 0.3 |
| Secondary Modern | 13.4% | -0.7% | 2.4 | -0.5 |
| Secondary Selective | 4.2% | -0.2% | 2.8 | -0.2 |
| Sixth Form College | 50.8% | 5.6% | 1.9 | 2.7 |
| Tertiary College | 22.9% | 12.1% | 1.2 | 4.9 |
GCSE outcomes by region
JCQ have published regional GCSE cumulative percentage outcomes, that we have replicated below for grades 7 and 4 (Table 18). As outlined above, it is important to bear in mind that there are long-standing differences in outcomes by region that exist every year.
The rank order of regions according to their results is extremely similar to 2020 and the percentage of students achieving both grades 7 and 4 has increased in all regions. As is the case every year, there is some variation in the size of the increase across regions. At grade 7 the greatest increase was in London where the rate has increased by 3.1pp. At grade 4 the greatest increase was in the North East where the rate has increased by 1.7pp.
Table 18. GCSE cumulative percentage outcomes by region compared to 2020
| Region | Cum % grade 7 2020 | Cum % grade 7 2021 | Cum % grade 4 2020 | Cum % grade 4 2021 | Grade 7 change (pp) 2021-2020 | Grade 4 change (pp) 2021-2020 |
|---|---|---|---|---|---|---|
| North East | 22.0 | 24.5 | 73.8 | 75.5 | 2.5 | 1.7 |
| North West | 23.5 | 25.9 | 74.2 | 75.0 | 2.4 | 0.8 |
| Yorkshire and the Humber | 22.3 | 24.4 | 72.6 | 73.5 | 2.1 | 0.9 |
| West Midlands | 23.0 | 25.3 | 73.3 | 74.3 | 2.3 | 1.0 |
| East Midlands | 23.0 | 25.1 | 74.9 | 75.4 | 2.1 | 0.5 |
| Eastern Region | 25.9 | 28.5 | 76.2 | 77.1 | 2.6 | 0.9 |
| South West | 26.1 | 29.1 | 77.6 | 78.6 | 3.0 | 1.0 |
| South East | 29.0 | 31.9 | 78.2 | 79.3 | 2.9 | 1.1 |
| London | 31.4 | 34.5 | 79.0 | 79.7 | 3.1 | 0.7 |
Annex A
Number of A level entries reported (by centres) as being from private candidates by subject (rounded to nearest 5, less than 5 replaced by 0~).
| Subject | 2017 | 2018 | 2019 | 2020 | 2021 |
|---|---|---|---|---|---|
| All Other Subjects | 185 | 265 | 175 | 45 | 65 |
| Art & Design Subjects | 65 | 85 | 60 | 25 | 40 |
| Biology | 2200 | 1355 | 1715 | 790 | 1095 |
| Business Studies | 415 | 385 | 400 | 120 | 250 |
| Chemistry | 1970 | 1390 | 1755 | 820 | 1115 |
| Classical Subjects | 160 | 135 | 120 | 25 | 55 |
| Computing | 50 | 40 | 70 | 25 | 50 |
| Design And Technology | 90 | 55 | 45 | 10 | 0~ |
| Drama | 45 | 50 | 15 | 15 | 15 |
| Economics | 815 | 540 | 640 | 230 | 250 |
| English Language | 155 | 85 | 60 | 35 | 70 |
| English Language & Literature | 90 | 65 | 55 | 20 | 55 |
| English Literature | 435 | 345 | 305 | 170 | 180 |
| French | 225 | 150 | 125 | 45 | 105 |
| Geography | 485 | 285 | 165 | 85 | 95 |
| German | 95 | 45 | 55 | 25 | 15 |
| History | 520 | 385 | 395 | 200 | 190 |
| Law | 200 | 175 | 170 | 25 | 110 |
| Mathematics | 3555 | 3435 | 3320 | 865 | 1280 |
| Mathematics (Further) | 485 | 510 | 445 | 120 | 155 |
| Media / Film / Tv Studies | 70 | 80 | 35 | 10 | 40 |
| Music | 40 | 20 | 40 | 20 | 15 |
| Other Modern Languages | 900 | 880 | 1245 | 275 | 555 |
| Other Sciences | 30 | 20 | 5 | 0 | 5 |
| Performing / Expressive Arts | 0~ | 0 | 10 | 0~ | 0~ |
| Physical Education | 65 | 40 | 20 | 10 | 15 |
| Physics | 905 | 670 | 730 | 290 | 405 |
| Political Studies | 345 | 400 | 305 | 100 | 105 |
| Psychology | 1120 | 755 | 840 | 295 | 515 |
| Religious Studies | 395 | 300 | 150 | 55 | 60 |
| Sociology | 435 | 345 | 335 | 110 | 235 |
| Spanish | 210 | 145 | 145 | 40 | 90 |
Annex B
Number of GCSE entries reported (by centres) as being from private candidates by subject (rounded to nearest 5, less than 5 replaced by 0~). Note there were some changes to subject availability following reform (for example, GCSE science).
| Subject | 2017 | 2018 | 2019 | 2020 | 2021 |
|---|---|---|---|---|---|
| Additional Science | 300 | NA | NA | NA | NA |
| Additional Science (Further) | 5 | NA | NA | NA | NA |
| Art And Design Subjects | 55 | 40 | 55 | 45 | 55 |
| Biology | 145 | 240 | 355 | 210 | 355 |
| Business Studies | 35 | 30 | 135 | 90 | 100 |
| Chemistry | 85 | 135 | 205 | 115 | 235 |
| Citizenship Studies | 5 | 20 | 20 | 15 | 20 |
| Classical Subjects | 75 | 95 | 130 | 85 | 110 |
| Computing | 25 | 30 | 35 | 55 | 85 |
| Design & Technology | 15 | 10 | 0~ | 0~ | 10 |
| Drama | 10 | 5 | 5 | 10 | 20 |
| Economics | 15 | 10 | 15 | 5 | 15 |
| Engineering | 0~ | 0 | 0 | 0 | 0 |
| English | 3070 | 3830 | 3125 | 2435 | 3305 |
| English Literature | 395 | 640 | 825 | 460 | 545 |
| French | 110 | 75 | 105 | 45 | 70 |
| Geography | 80 | 85 | 140 | 65 | 105 |
| German | 45 | 40 | 75 | 20 | 40 |
| History | 90 | 190 | 255 | 215 | 200 |
| Mathematics | 6830 | 5860 | 5155 | 2690 | 4165 |
| Media / Film / Tv Studies | 40 | 40 | 20 | 35 | 20 |
| Music | 40 | 30 | 50 | 35 | 25 |
| Other Modern Languages | 1495 | 1895 | 1220 | 805 | 1265 |
| Other Sciences | 80 | 20 | 60 | 5 | 10 |
| Performing / Expressive Arts | 105 | 75 | 100 | 85 | 90 |
| Physical Education | 50 | 10 | 15 | 30 | 30 |
| Physics | 75 | 125 | 185 | 115 | 205 |
| Religious Studies | 435 | 210 | 300 | 220 | 255 |
| Science | 555 | NA | NA | NA | NA |
| Social Science Subjects | 405 | 480 | 320 | 110 | 260 |
| Spanish | 150 | 120 | 140 | 70 | 80 |
| Statistics | 15 | 25 | 60 | 30 | 45 |
| Food Preparation & Nutrition | NA | 15 | 5 | 0~ | 20 |
| Science: Double Award | NA | 800 | 1220 | 840 | 925 |
-
Note that any comparisons to 2020 are considered as percentage point (pp) changes throughout this report. ↩
-
‘Other’ centres, for example, college of higher education, university department, tutorial college, language school, special school, pupil referral unit (PRU), HM Young Offender Institute (HMYOI), HM Prison, training centre. ↩
-
Note that JCQ also publish post-16 outcomes, but do not break this down by age group. ↩